Introduction
I wanted to make sure that recommendations regarding McDonald’s non-centrality index and \(\hat\gamma\) applied well to the Life in Time measurement models (see below references). To check this, I generated data from a group-invariant model, and compared these fit indices when group-invariant versus non-invariant models were estimated using those data. The results are below.
The model
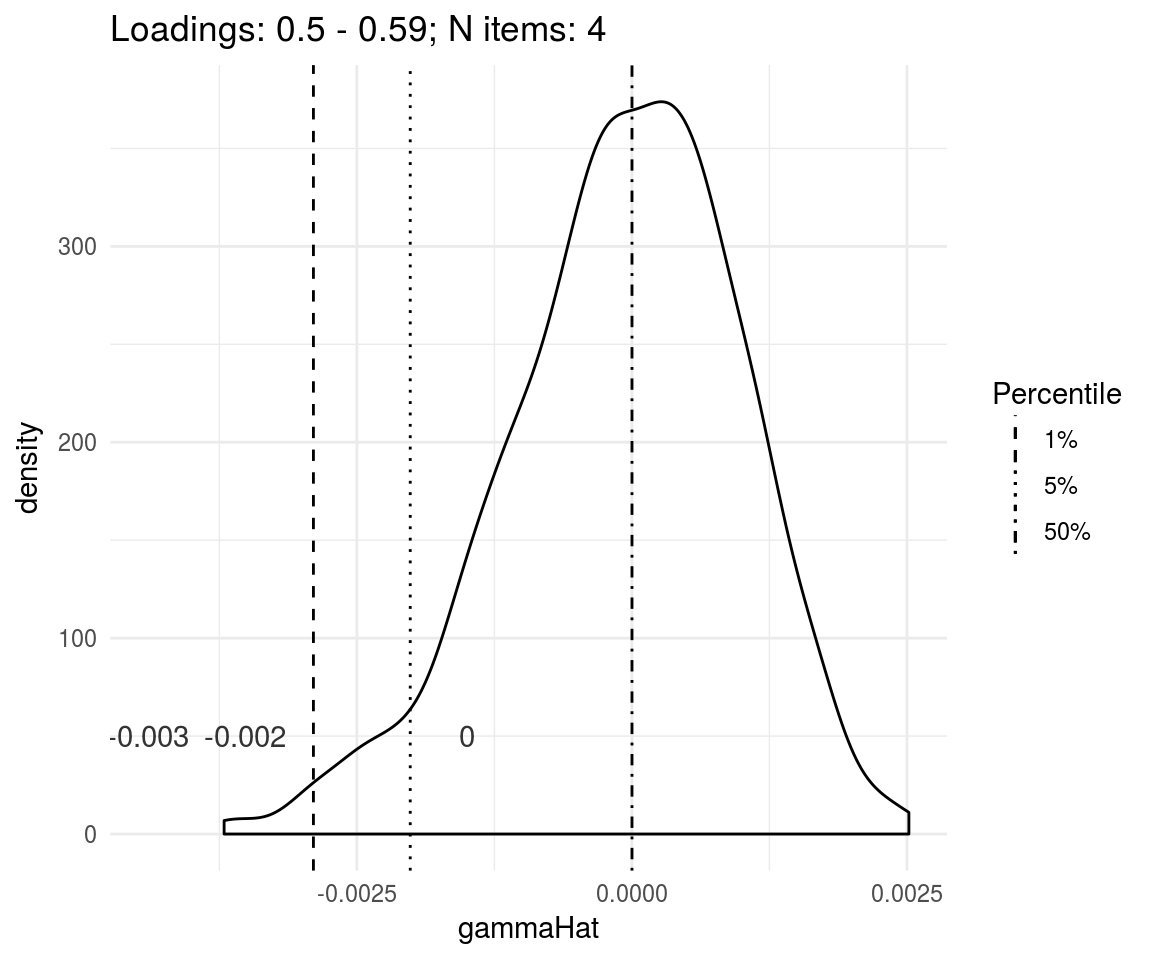
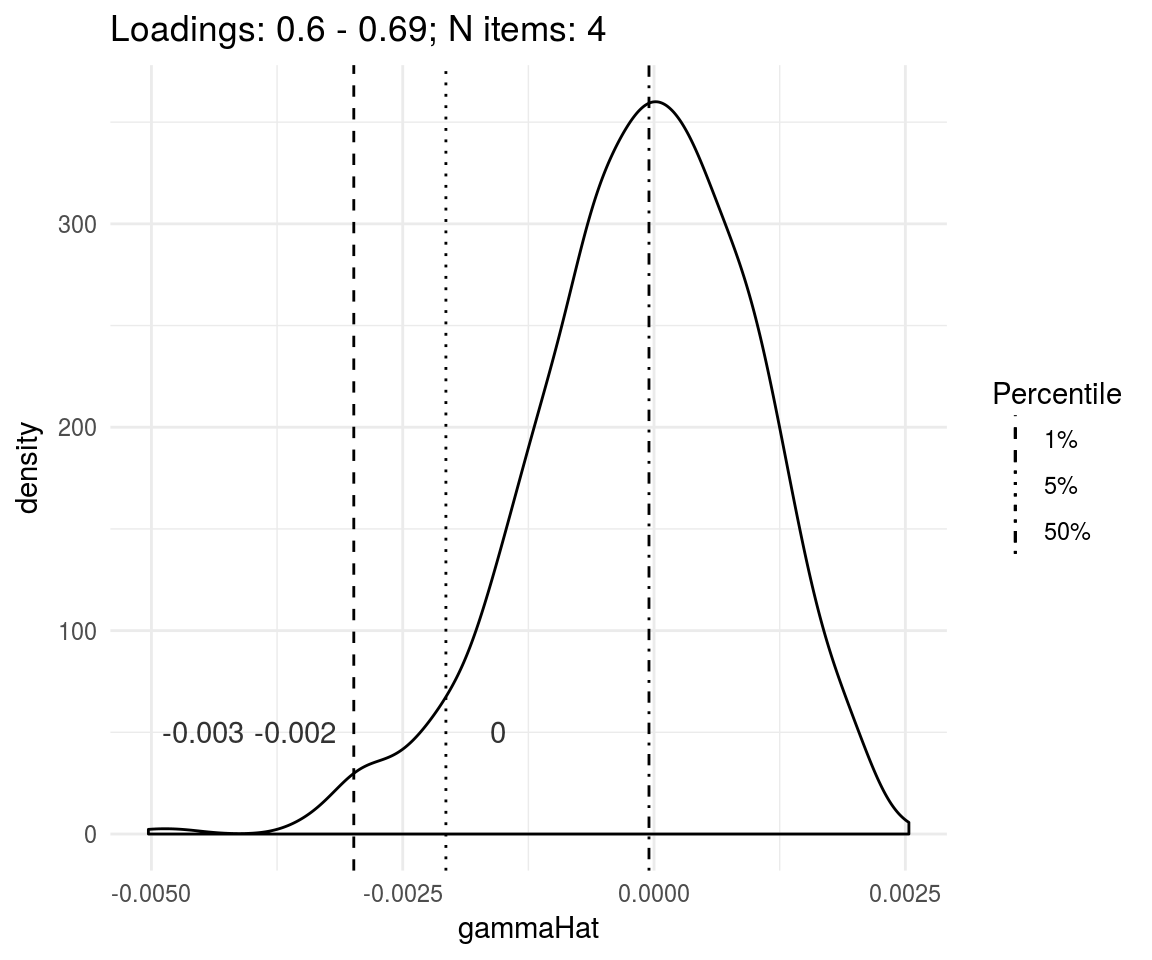
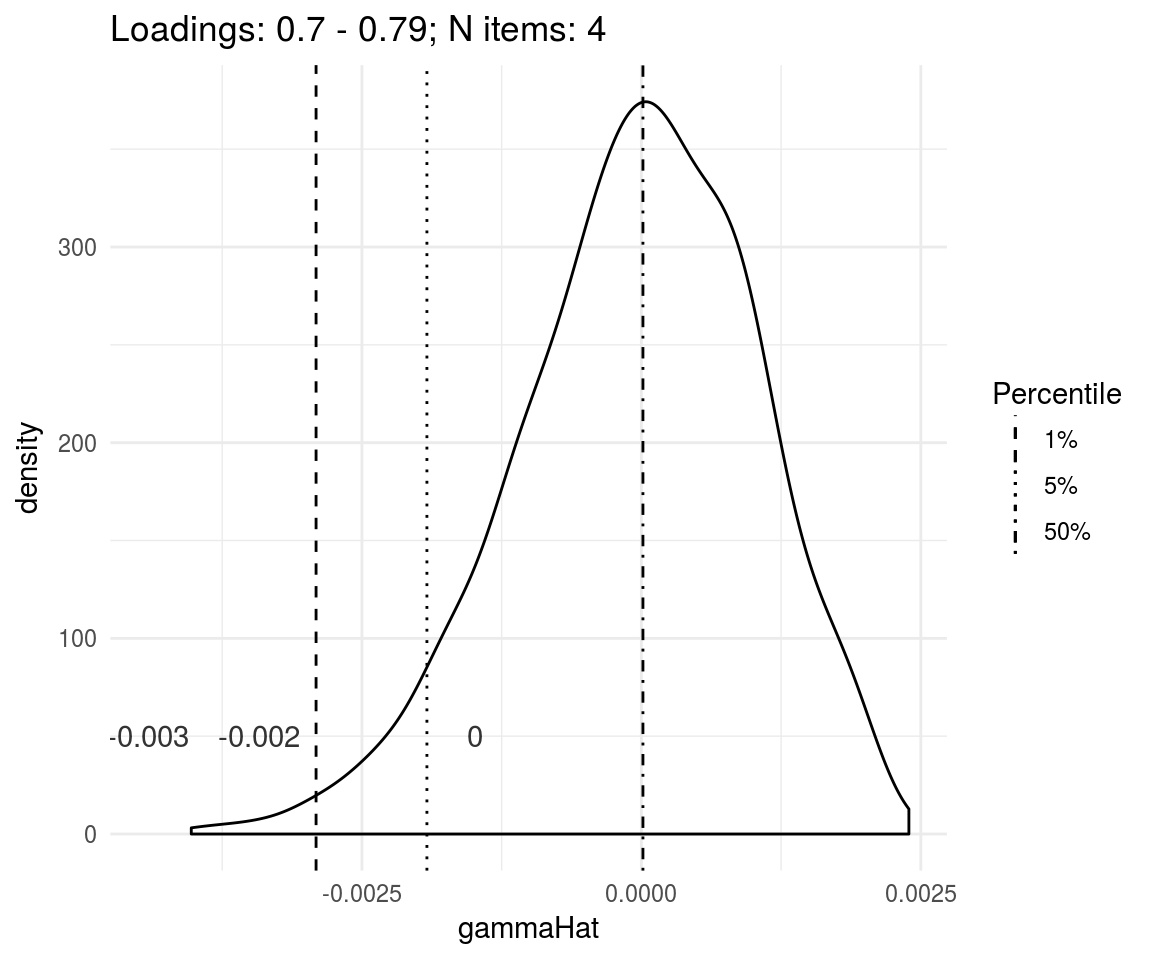
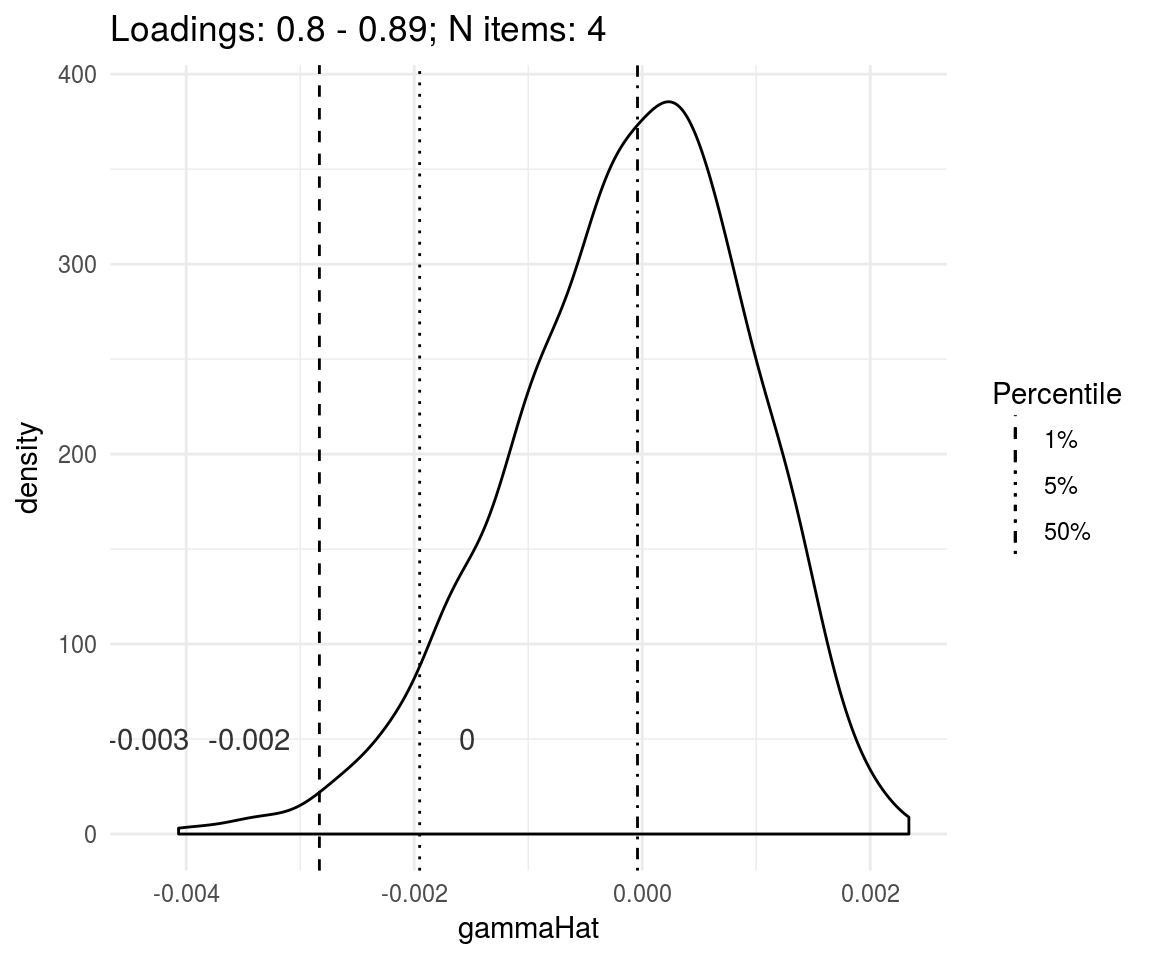
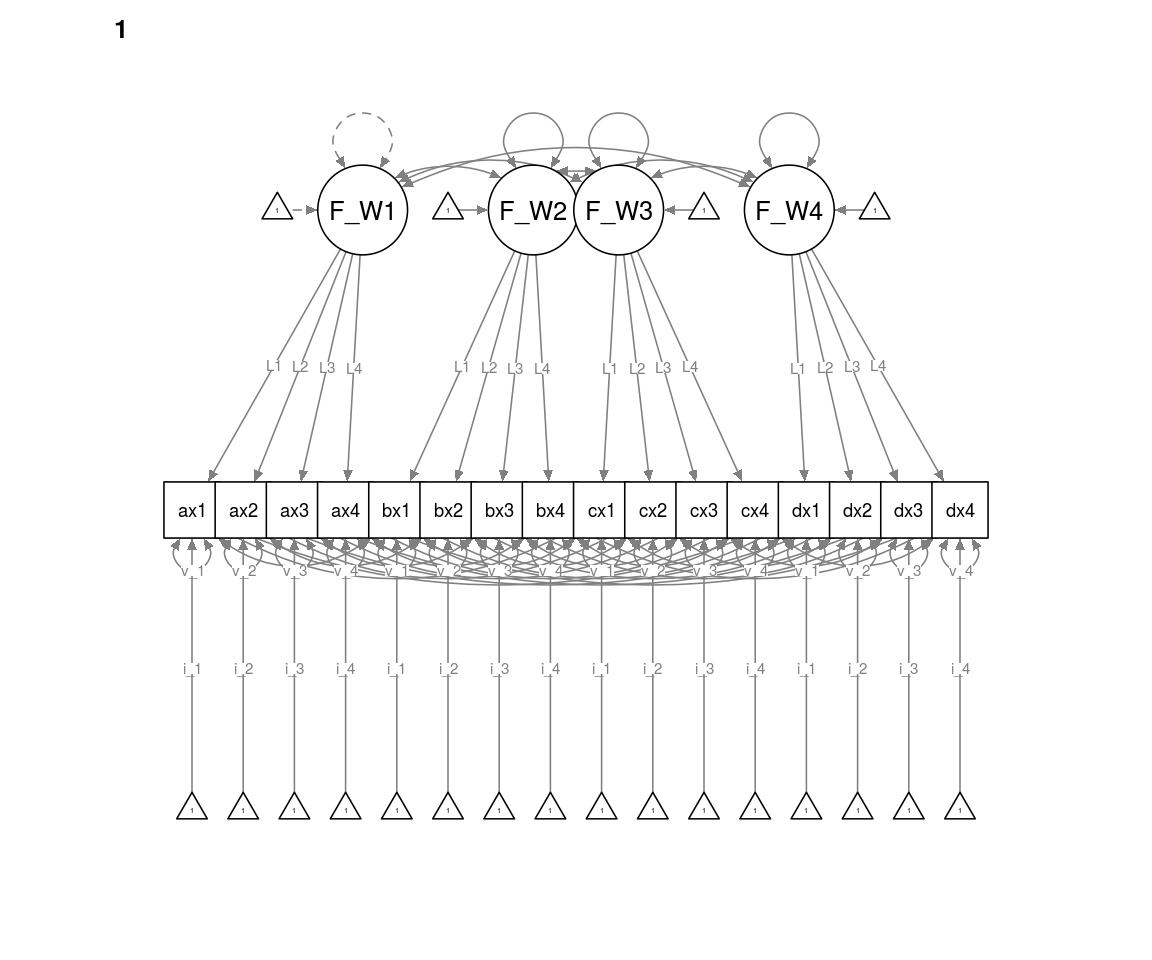
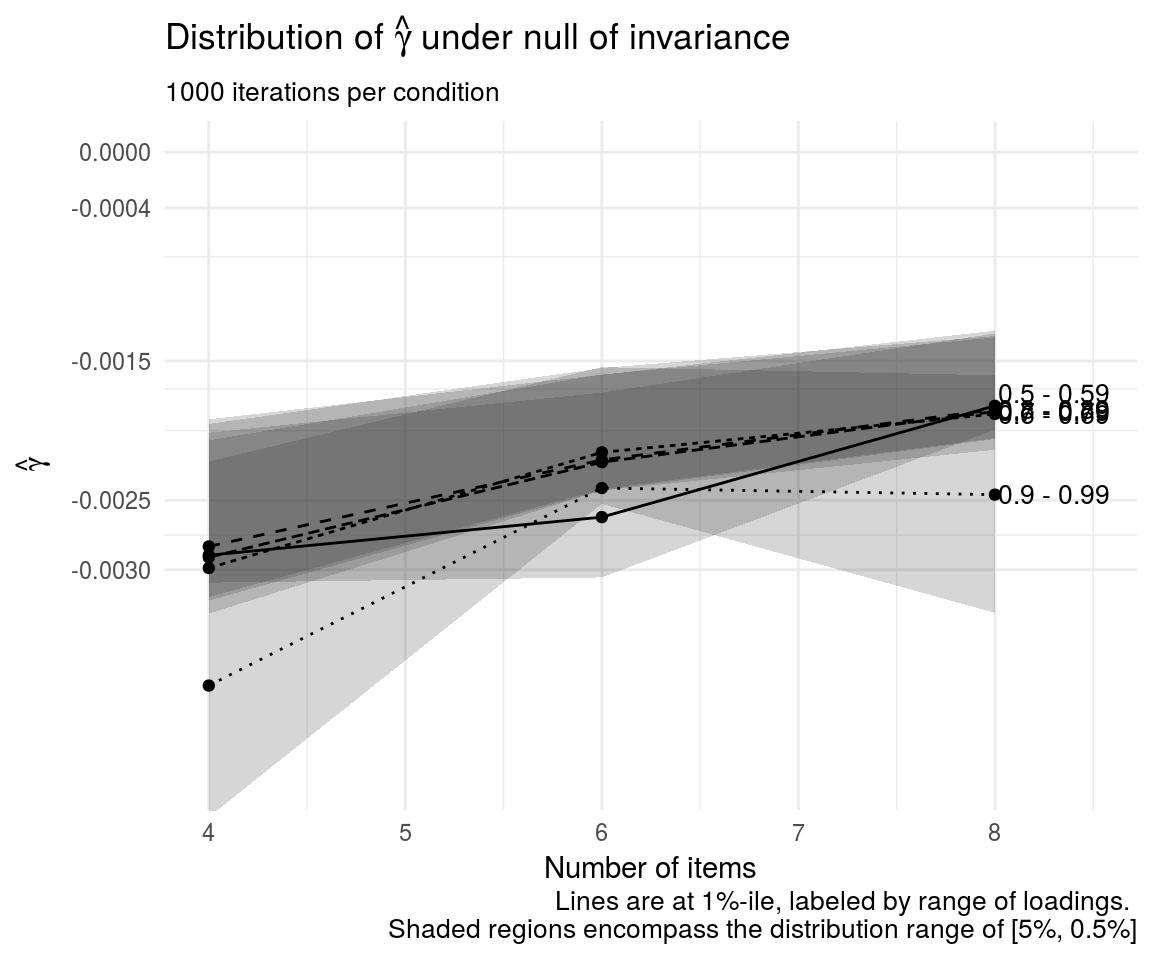
Each iteration evaluates the fit to the below model, either with loadings, intercepts, and residual variances constrained to be the same across 4 groups, or unconstrained. Strict longitudinal invariance is assumed in all models. Conditions vary the number of items per factor (the 4 item case is pictured below), and the strength of loadings. Each iteration draws the loadings randomly from a uniform distribution in a certain range.
Variations across items and loadings
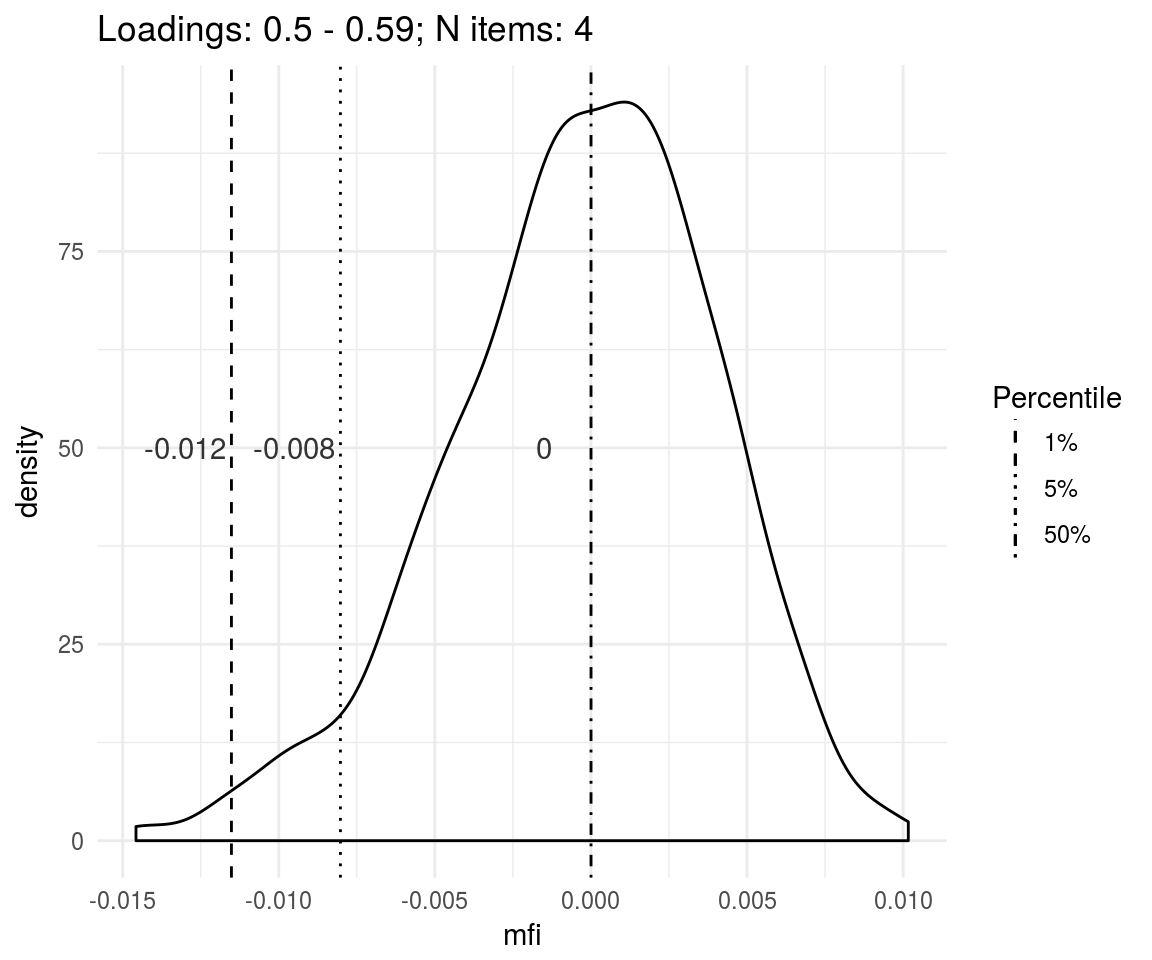
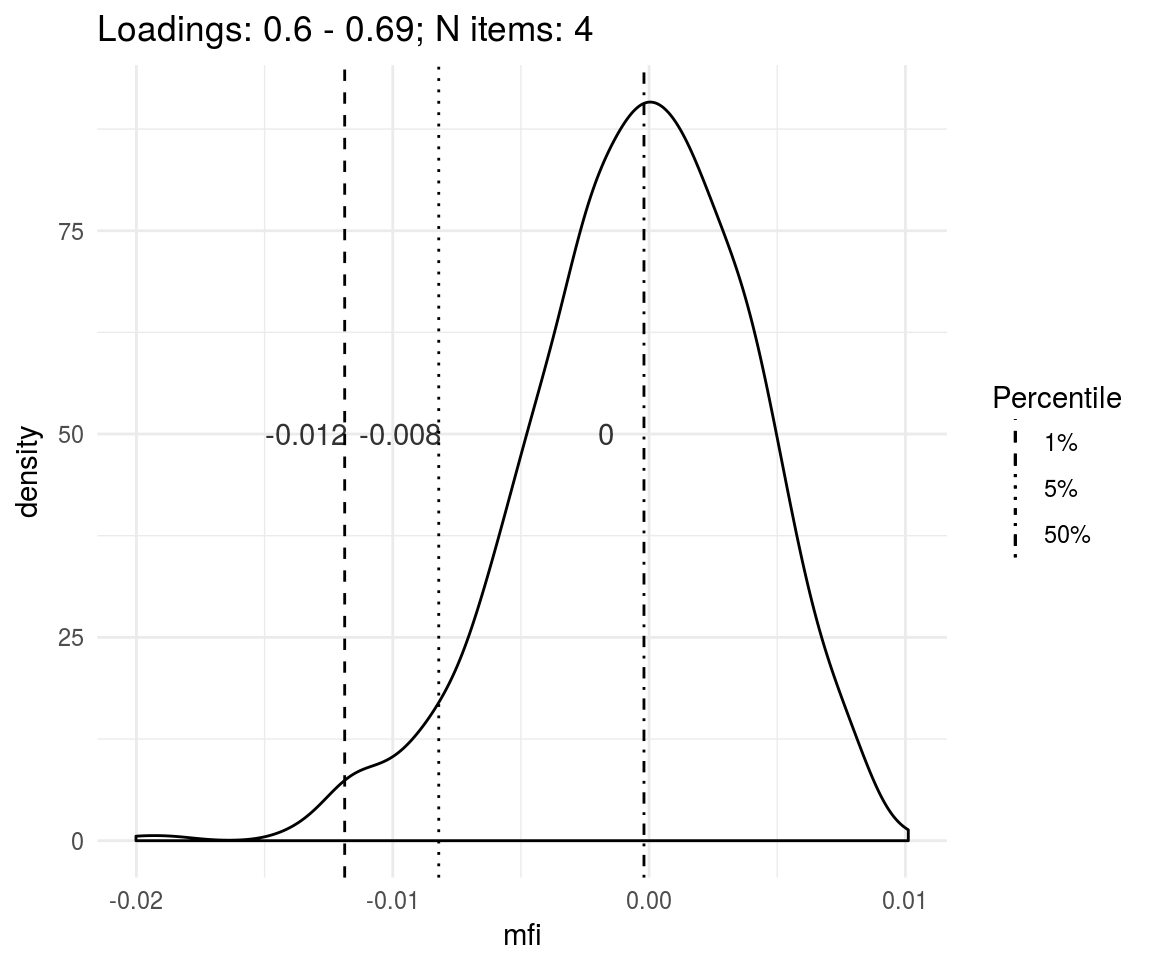
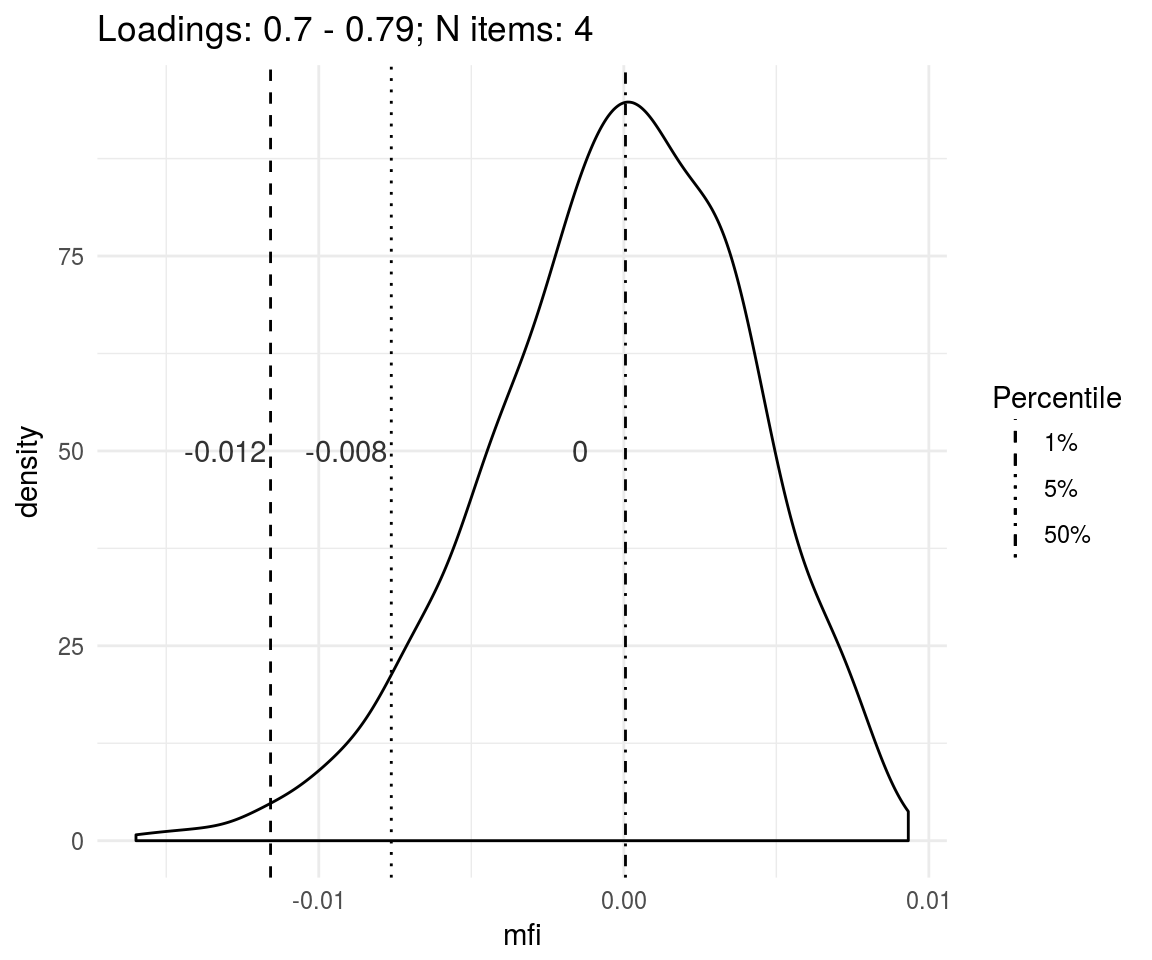
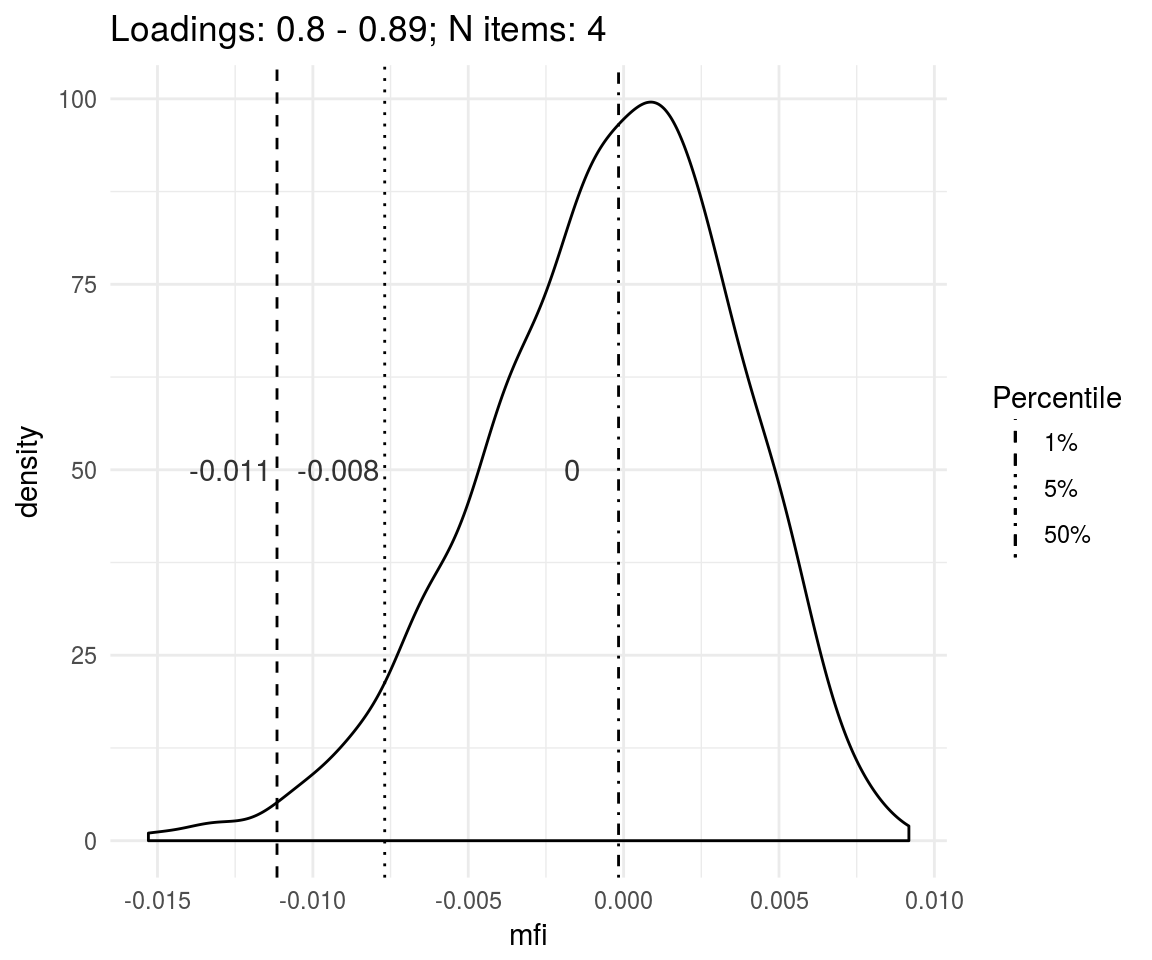
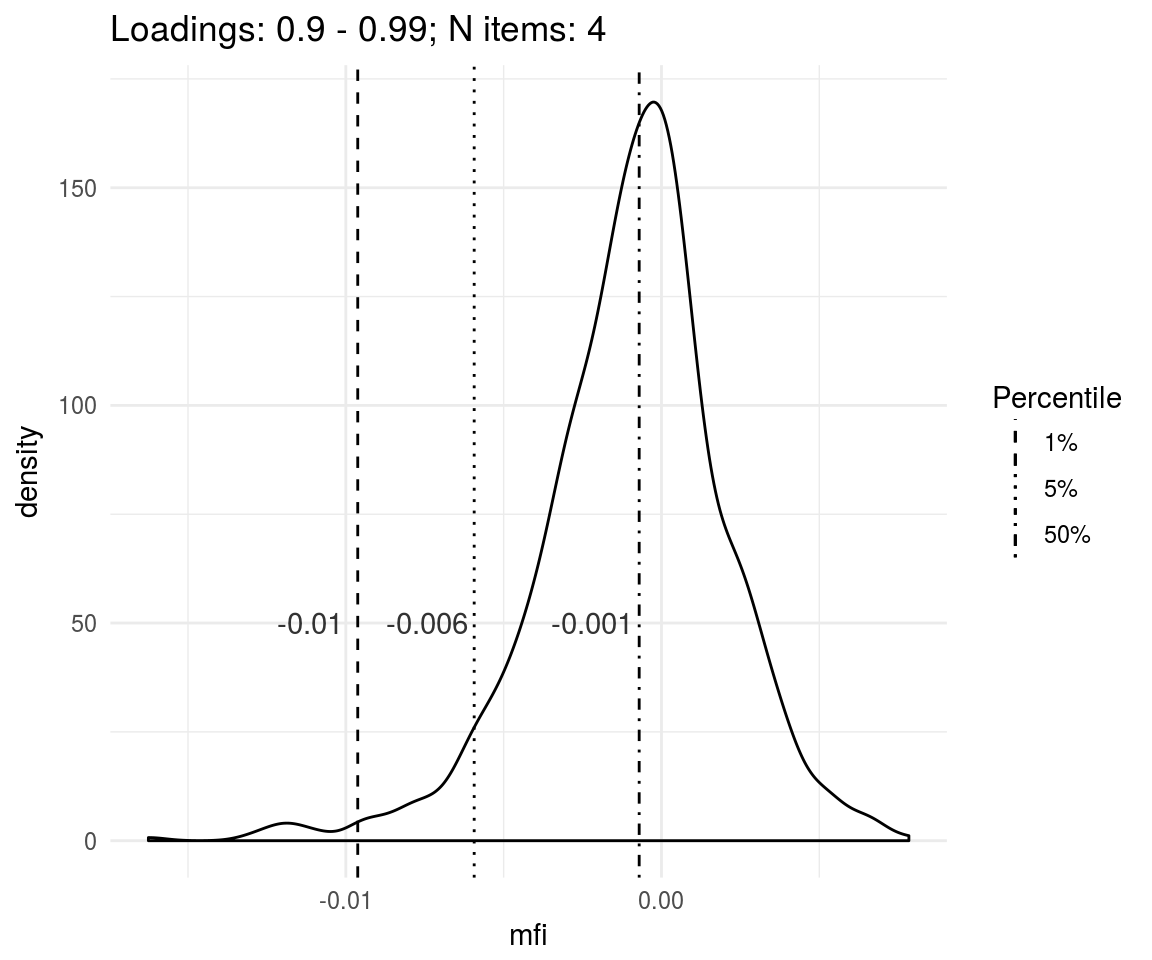
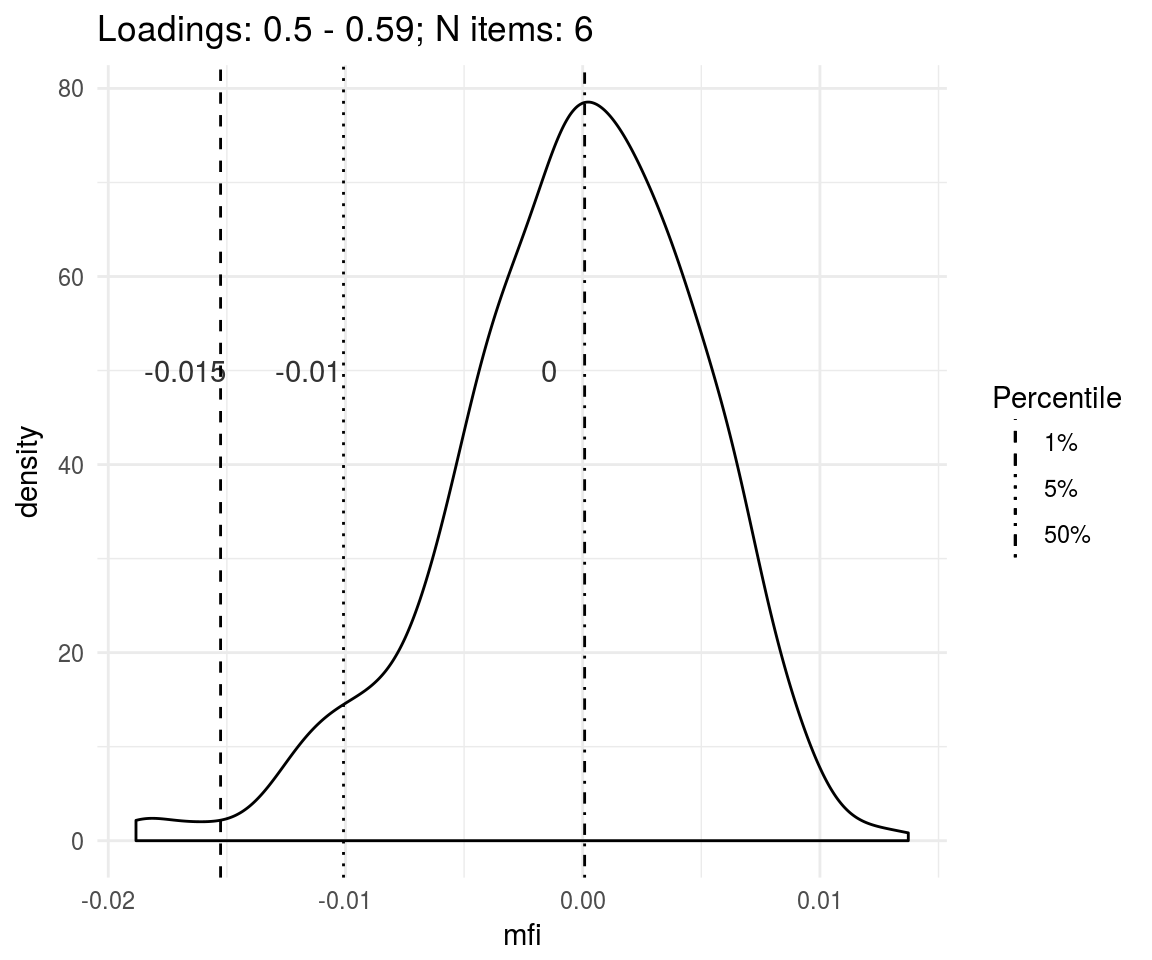
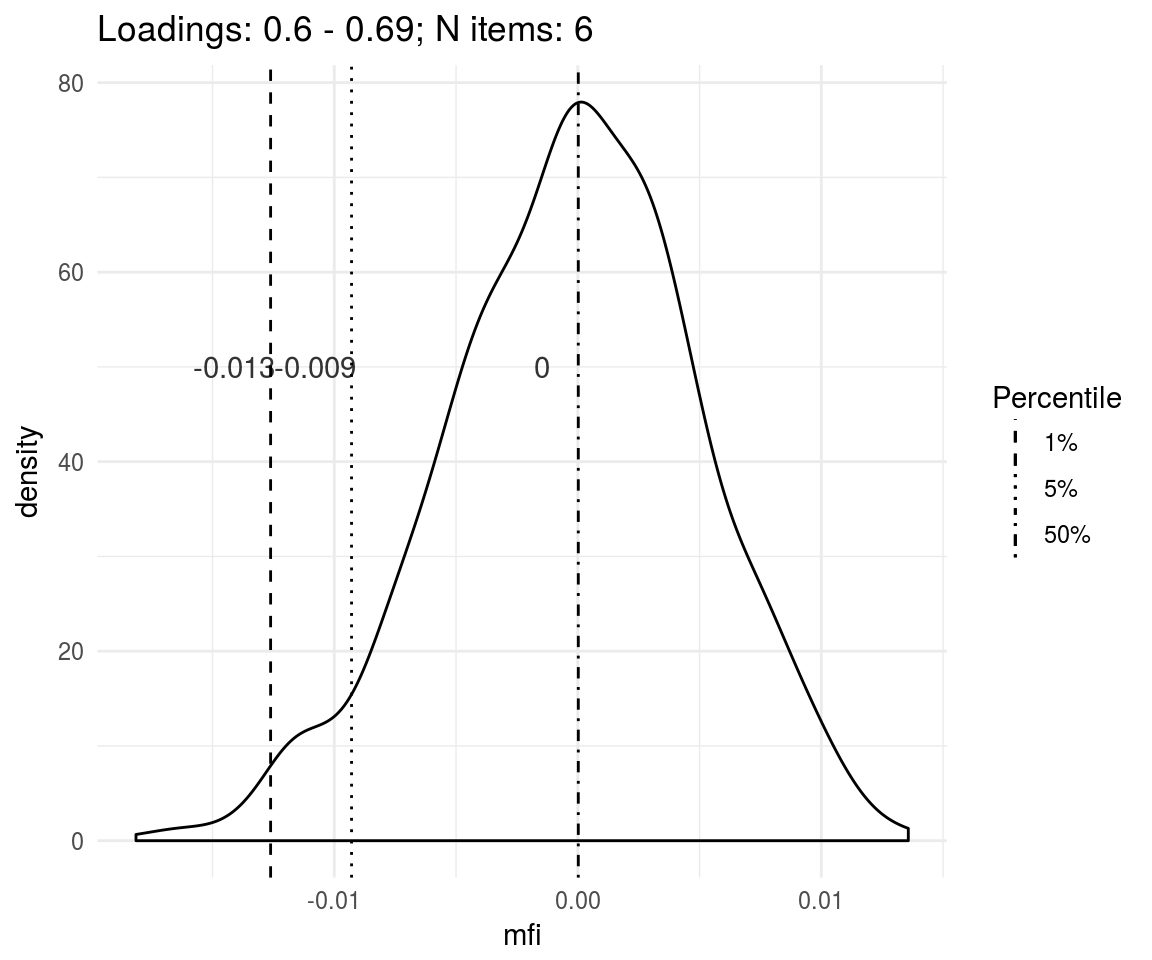
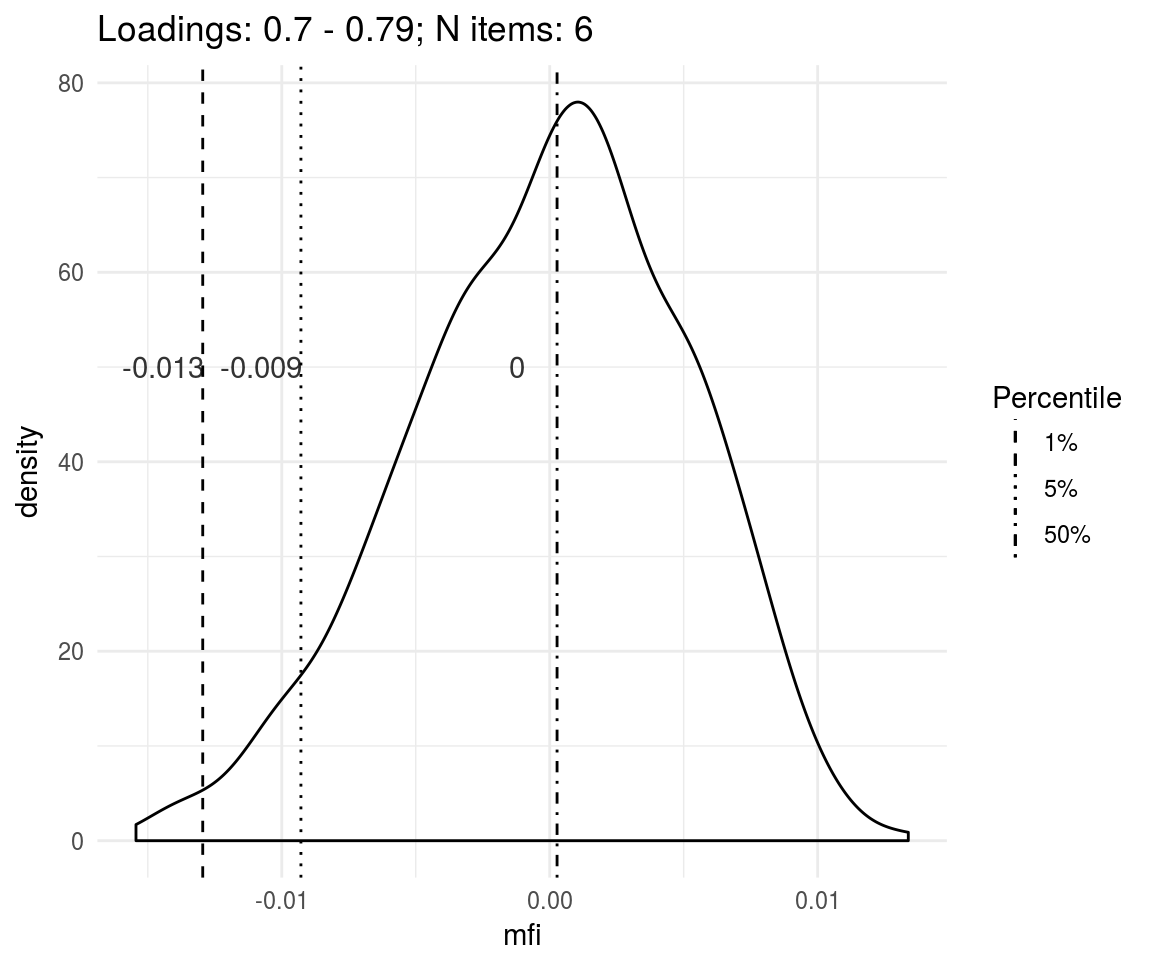
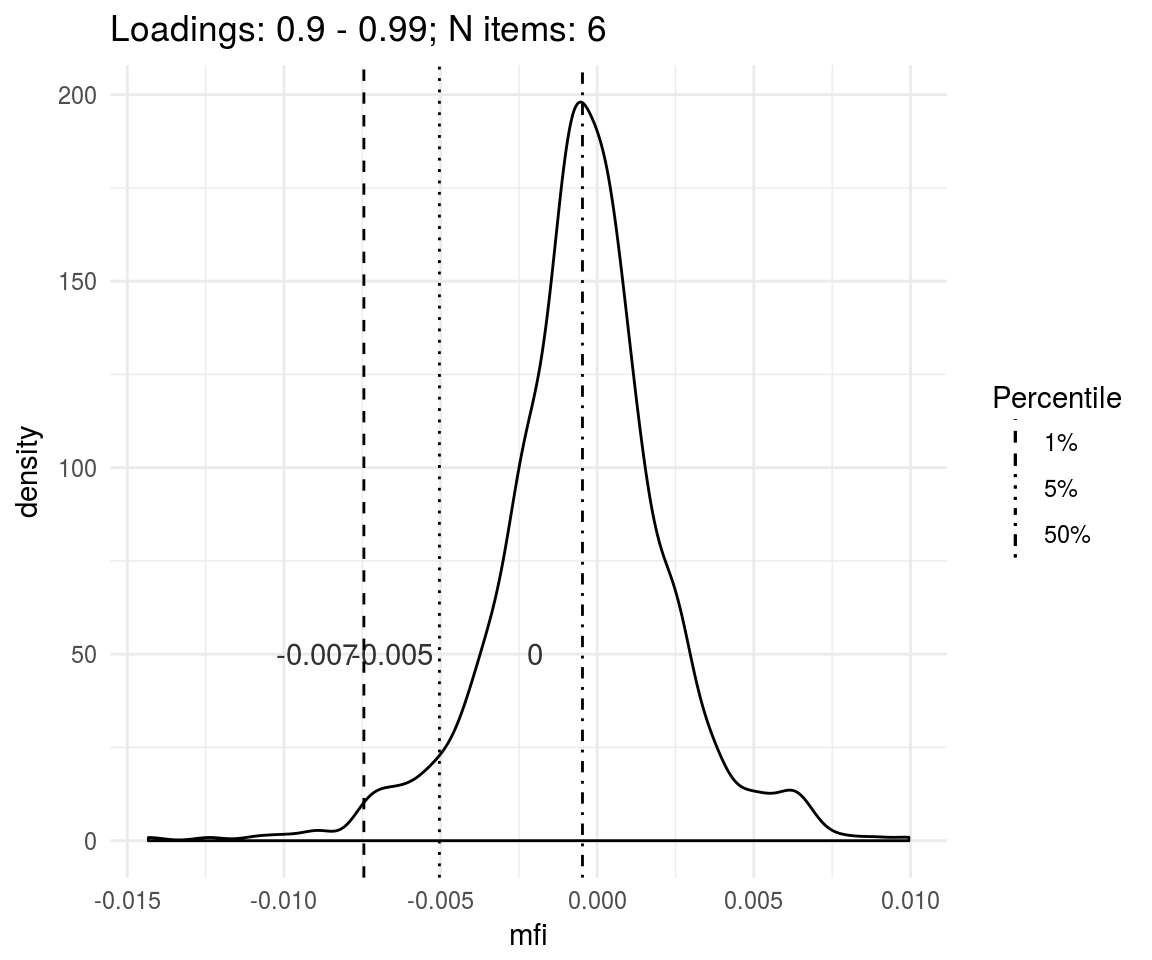
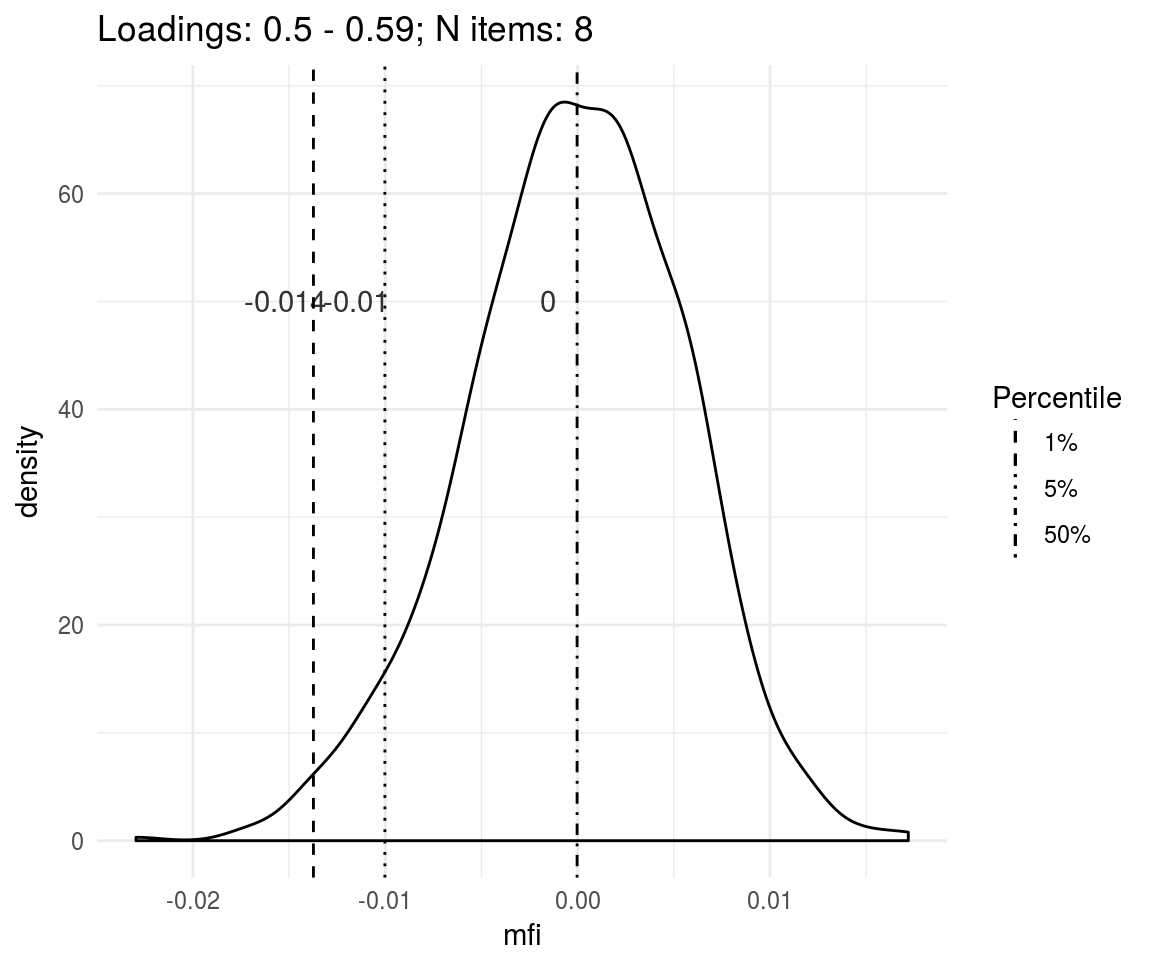
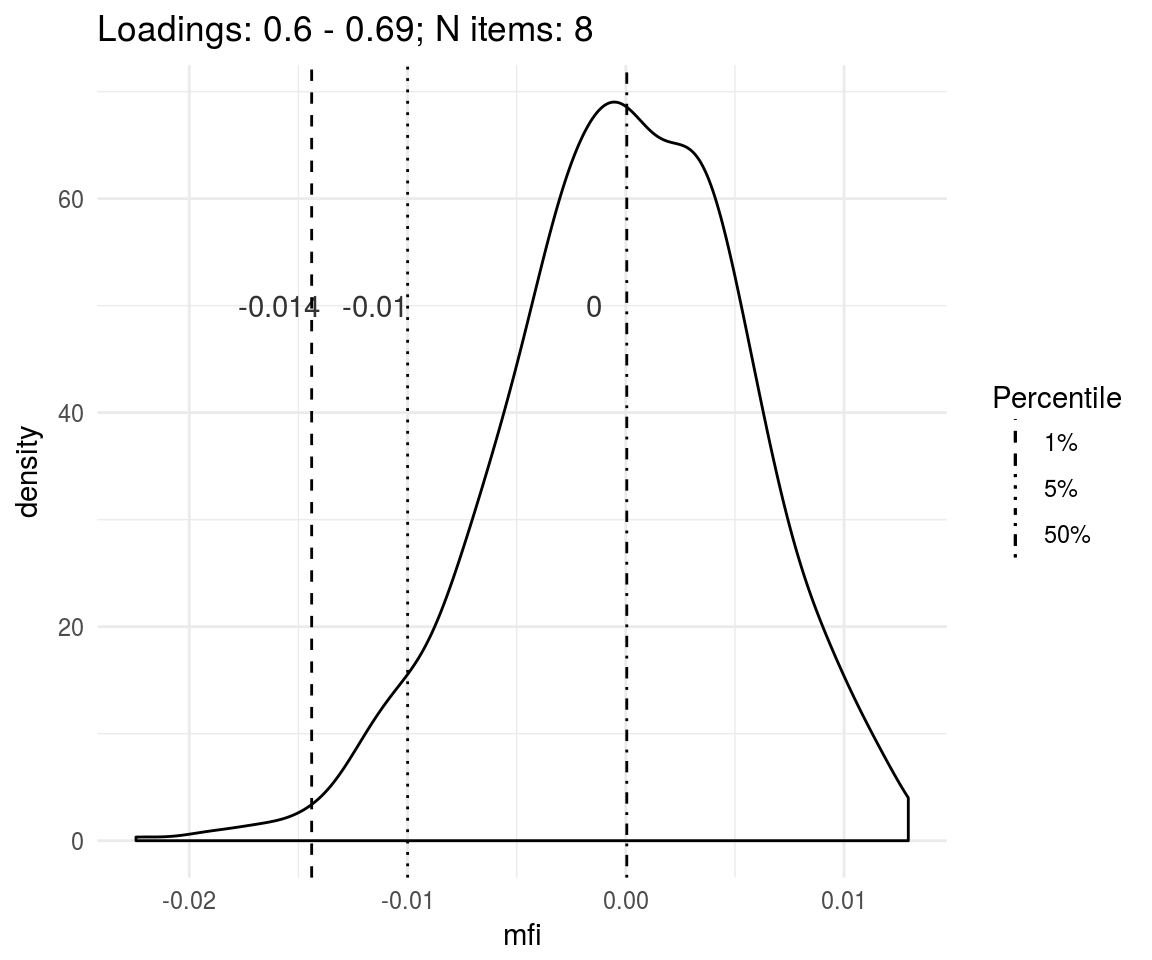
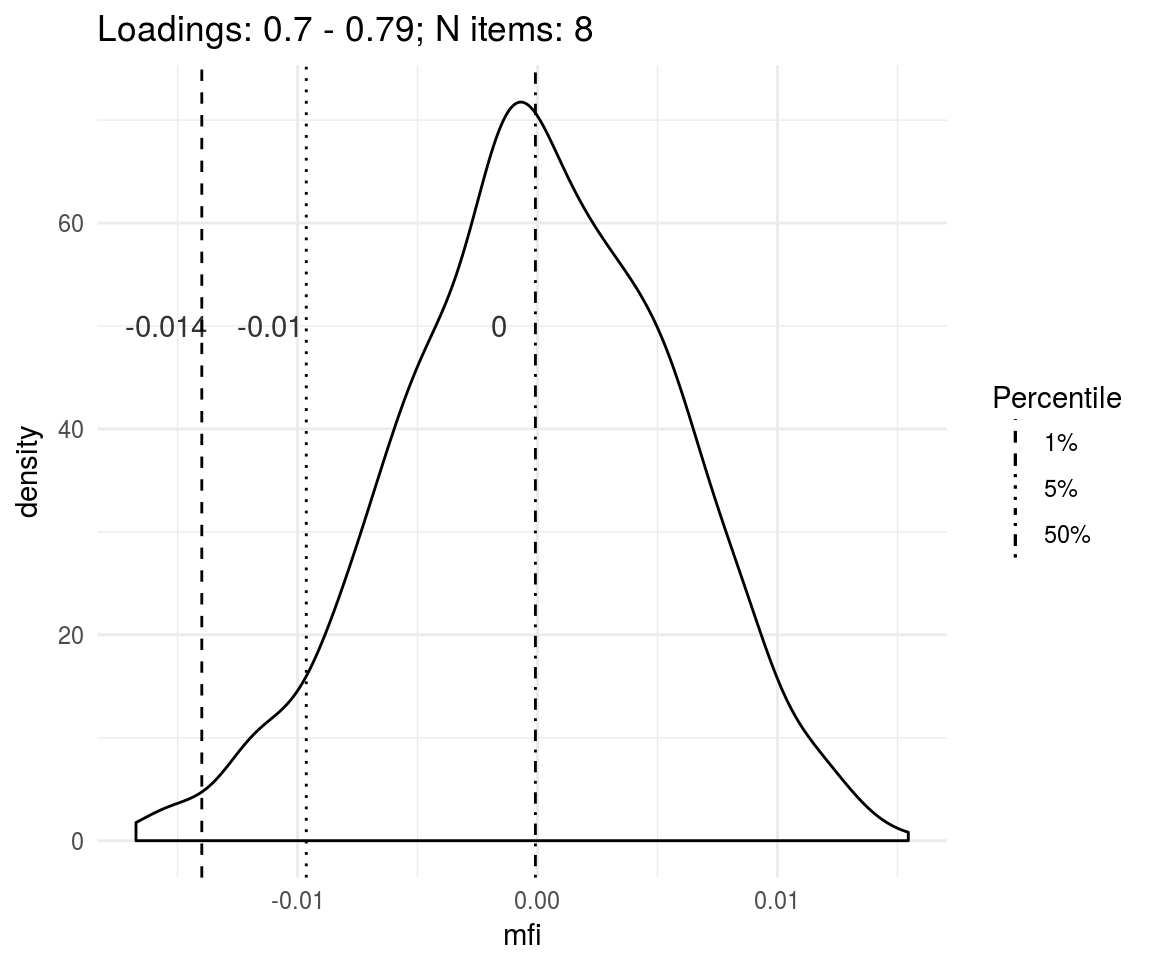
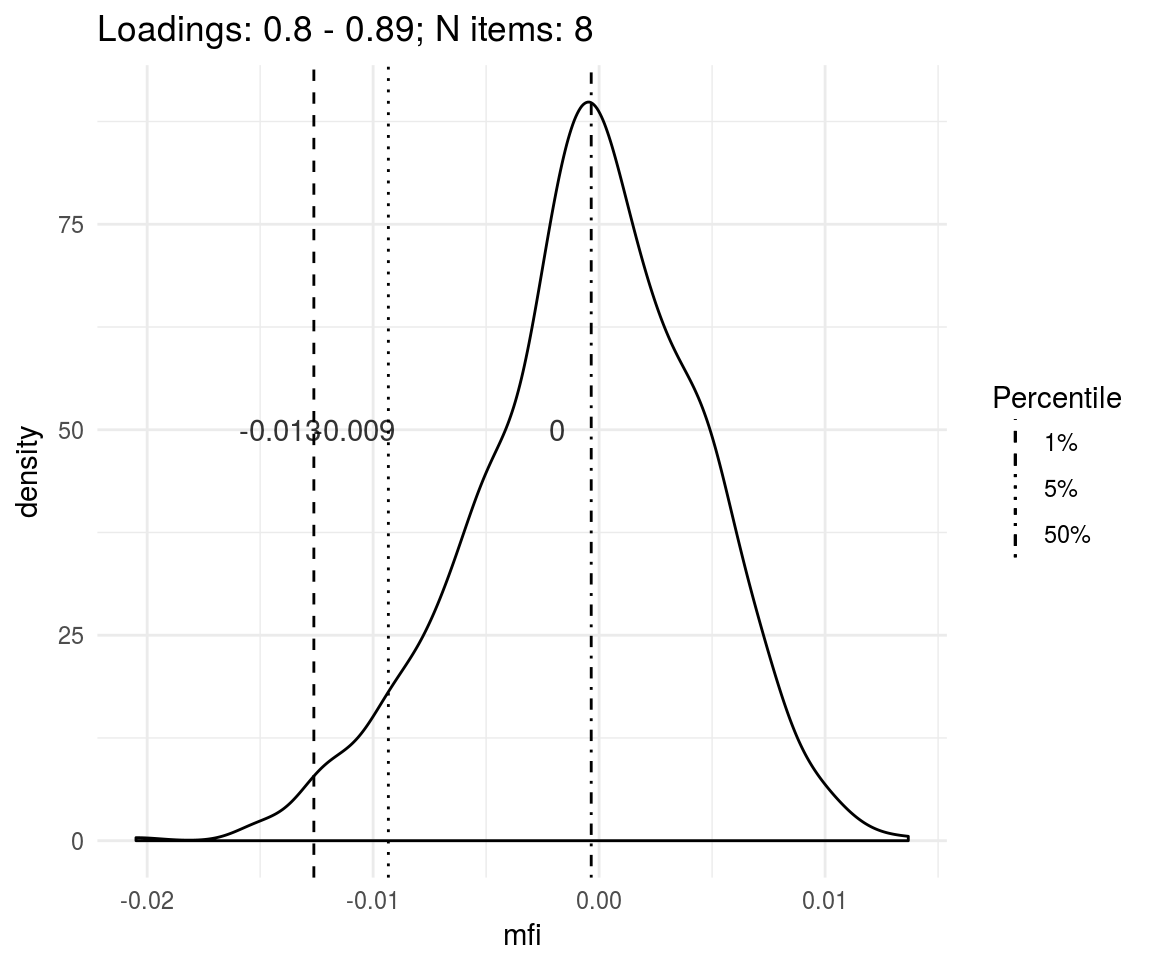
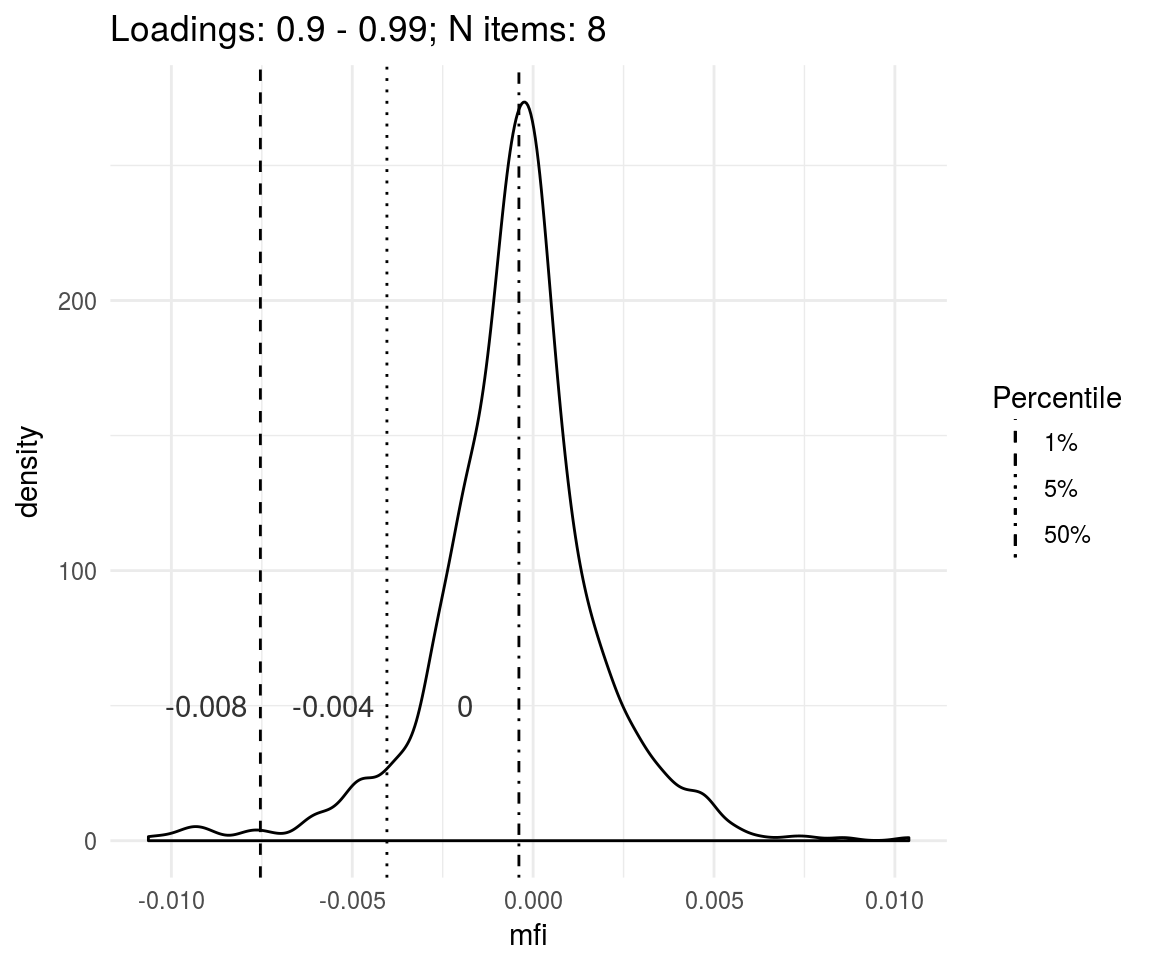
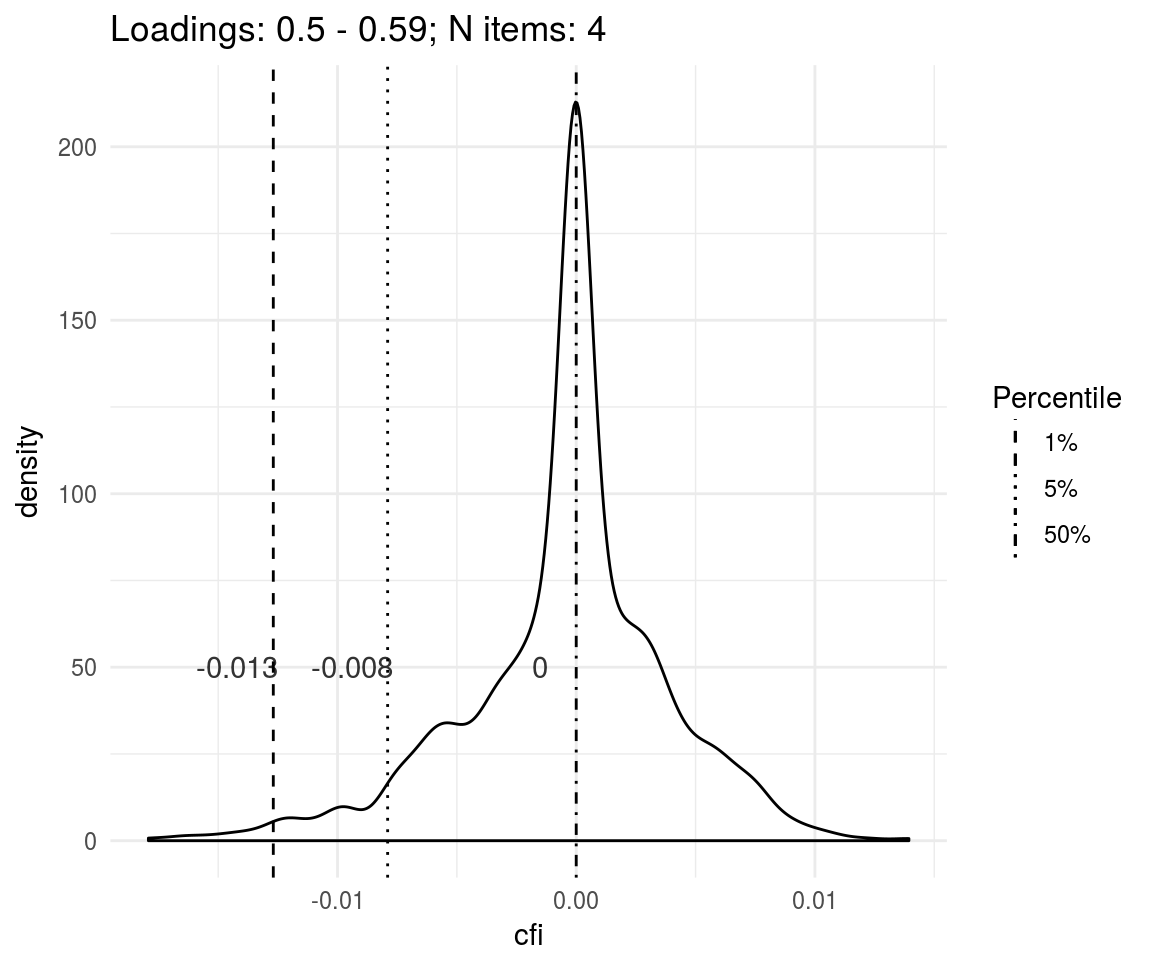
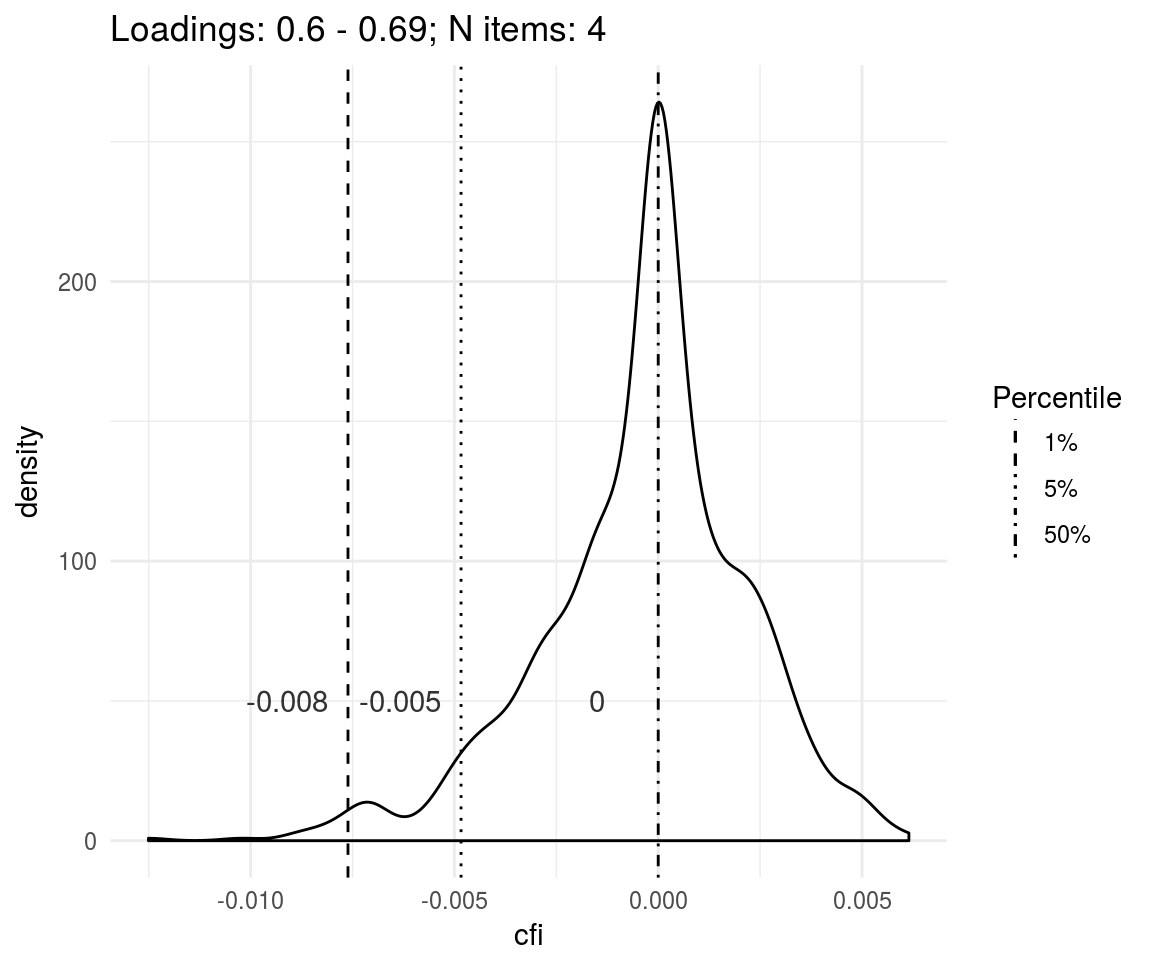
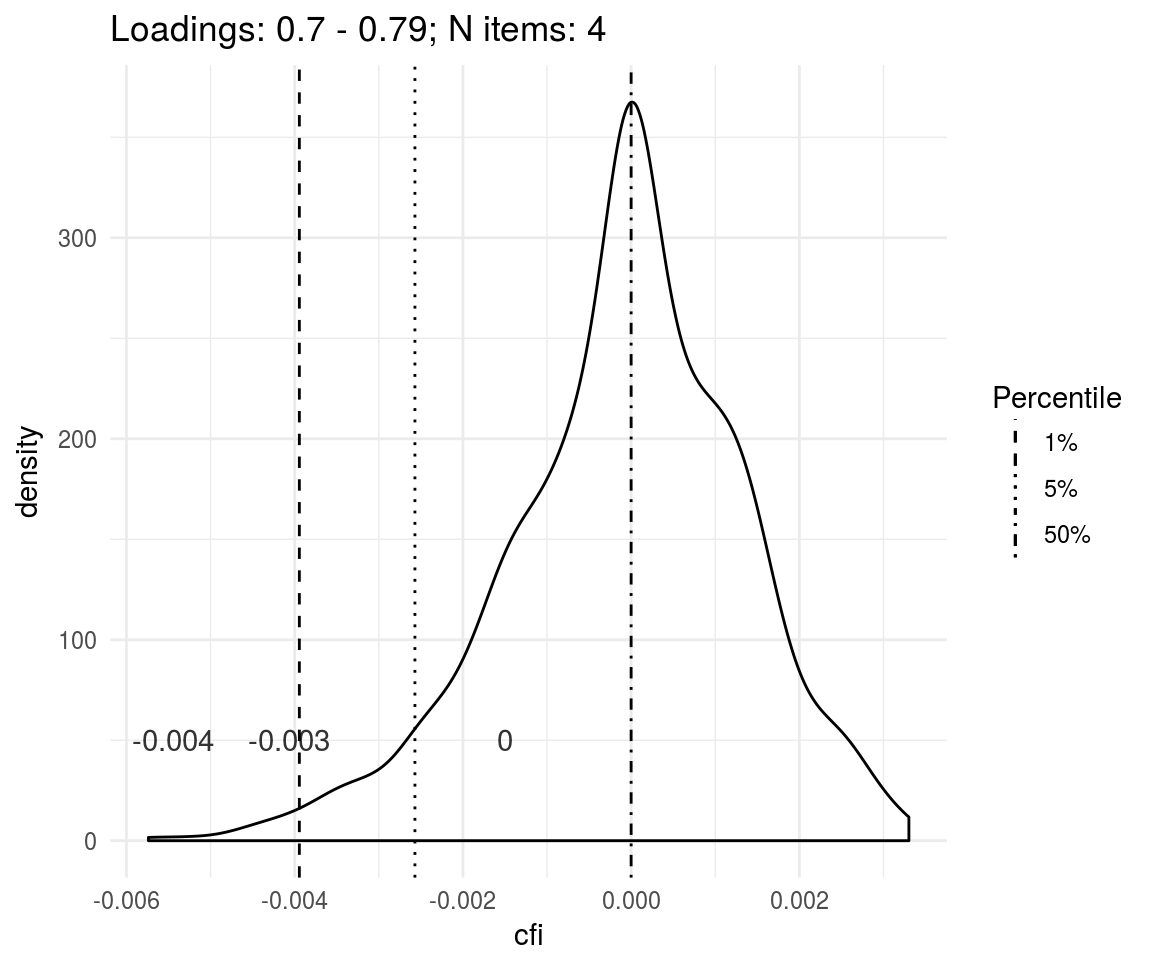
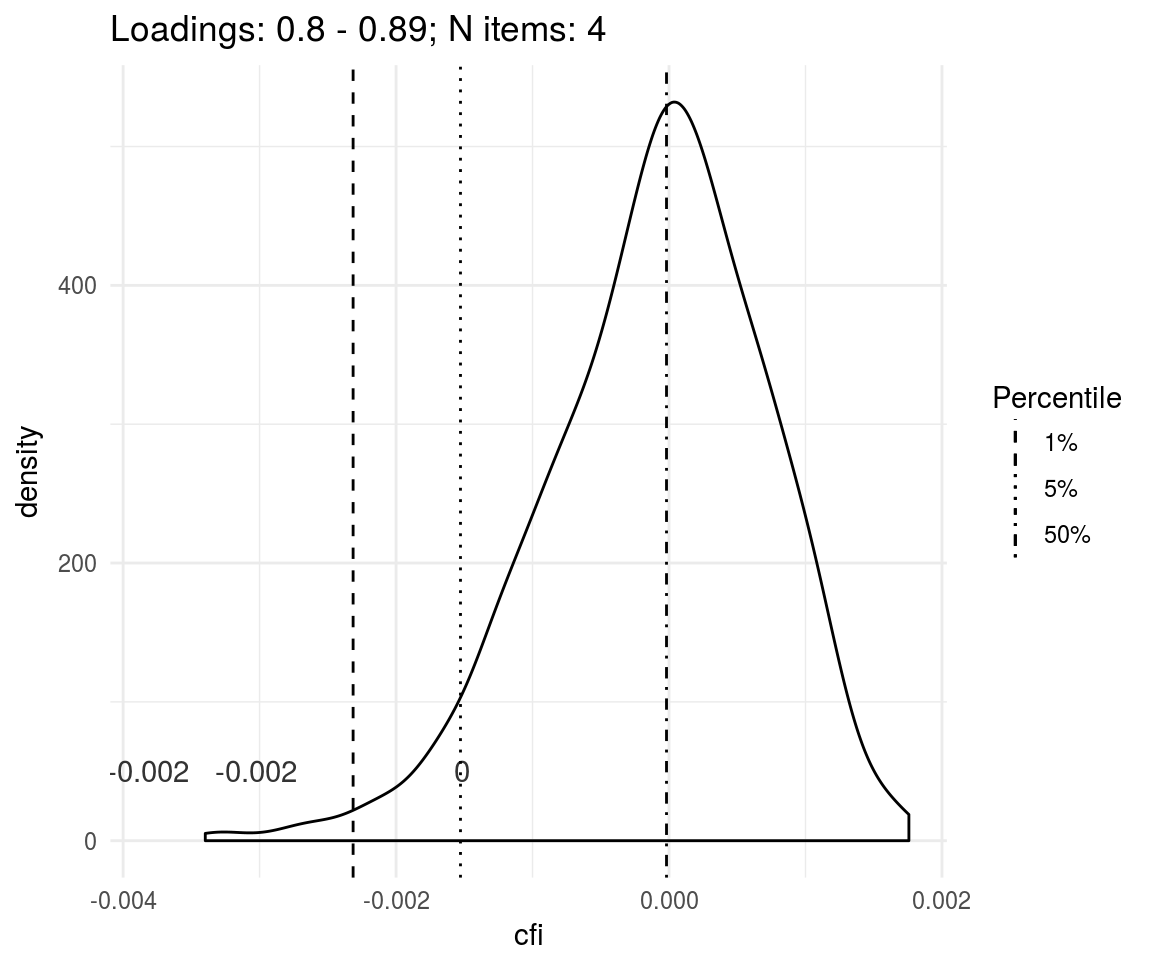
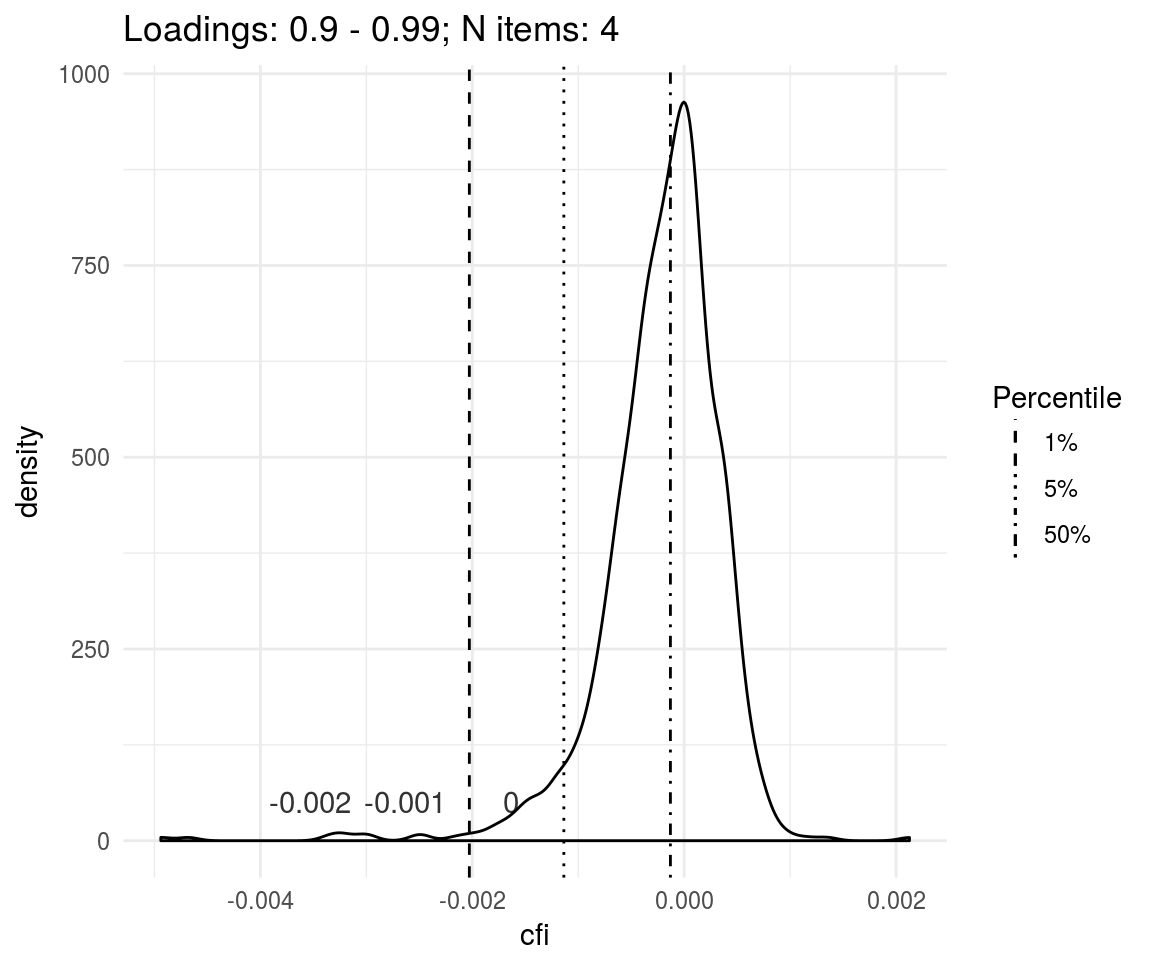
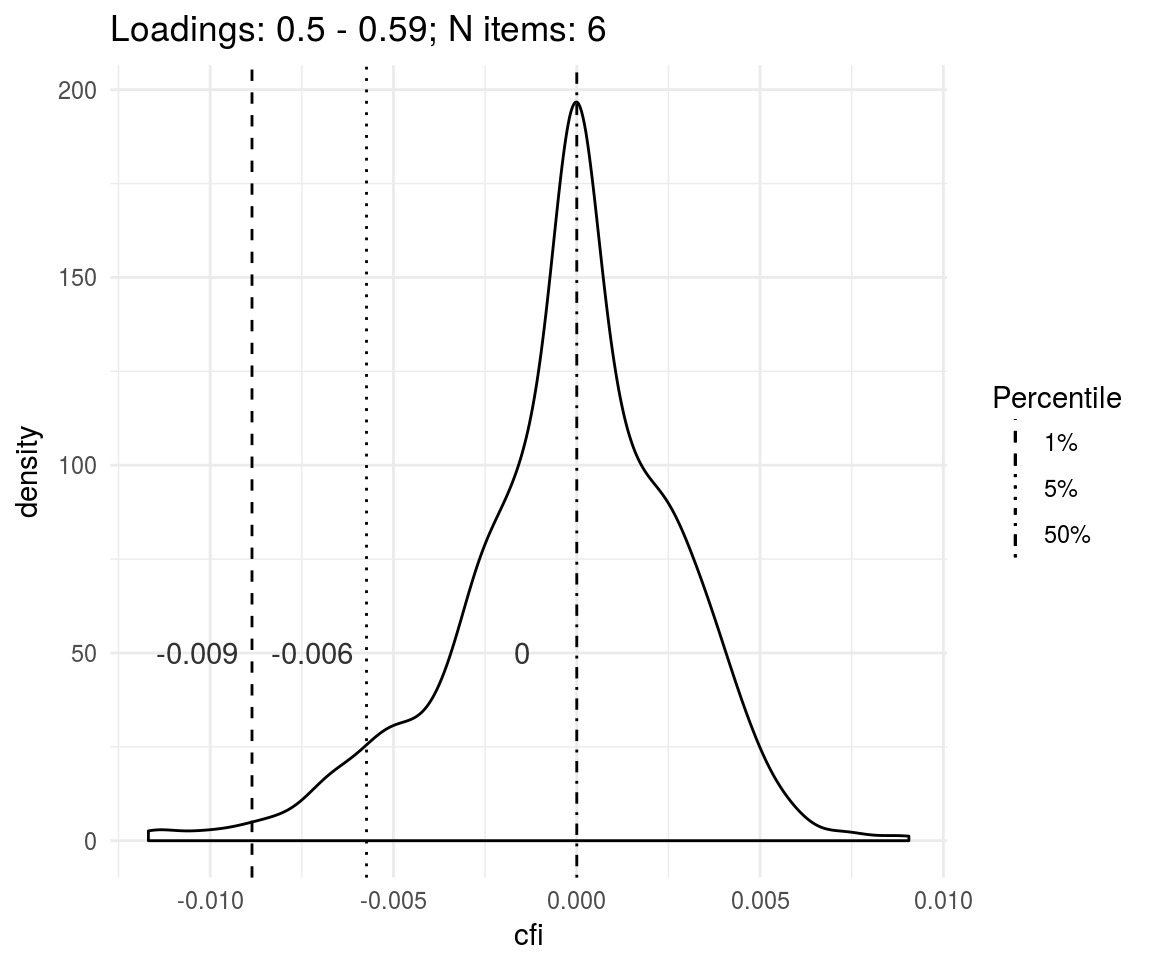
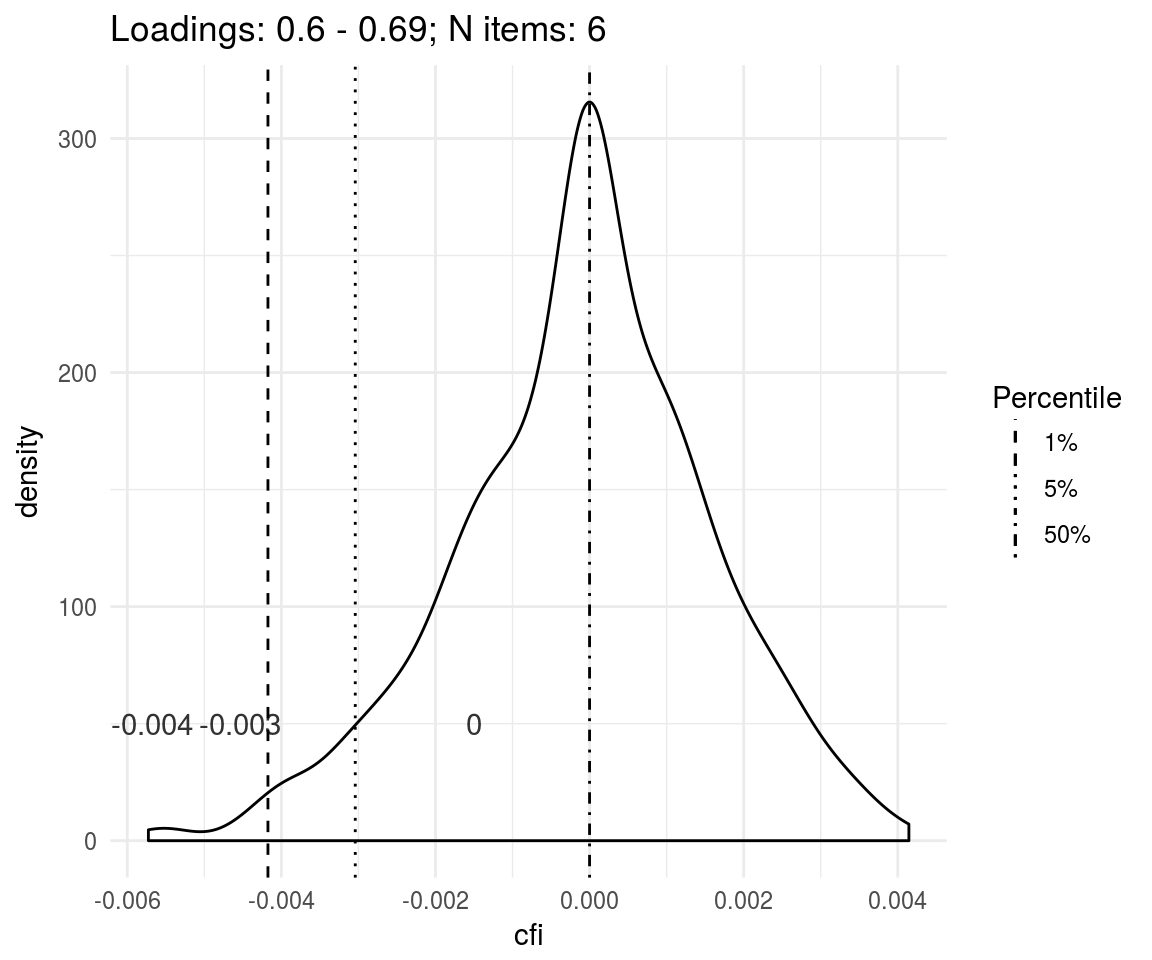
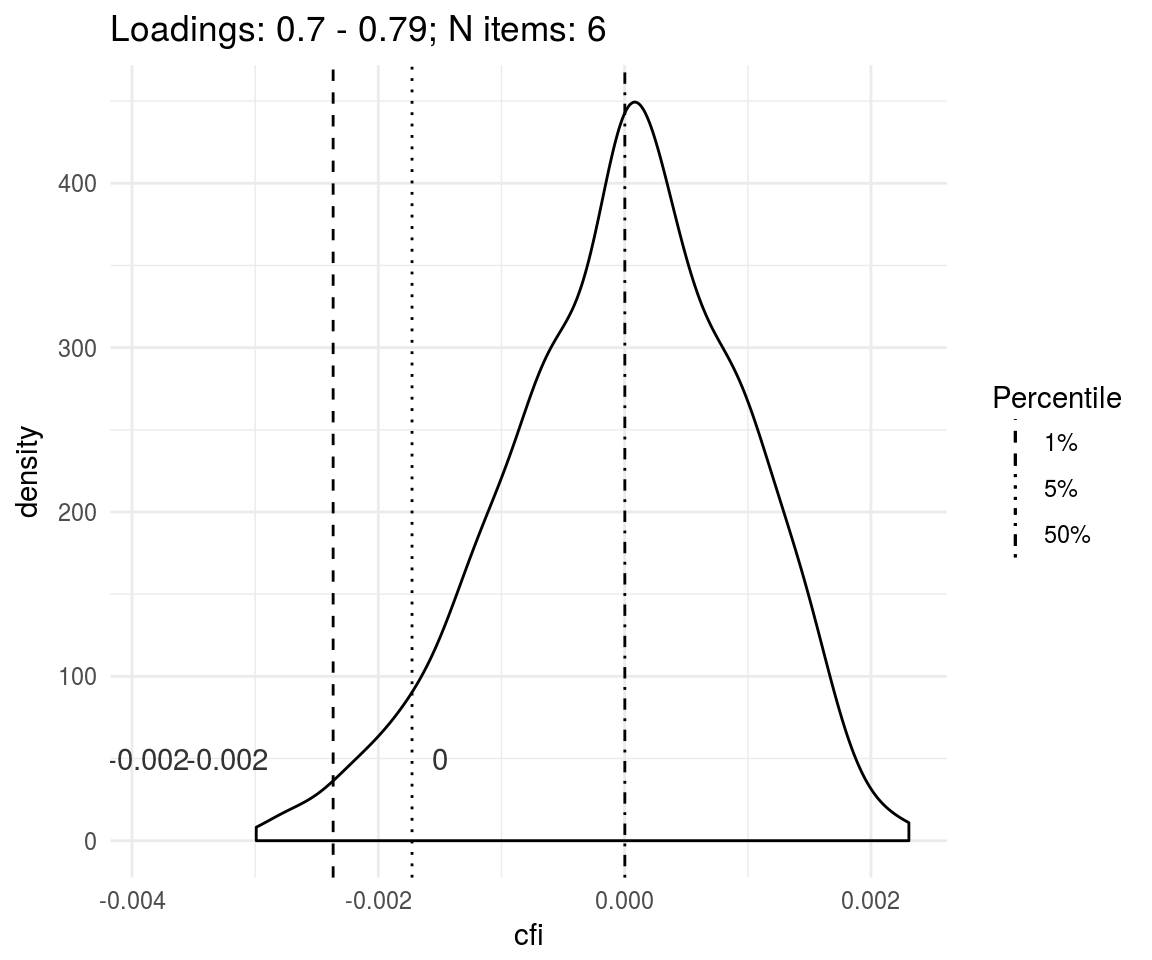
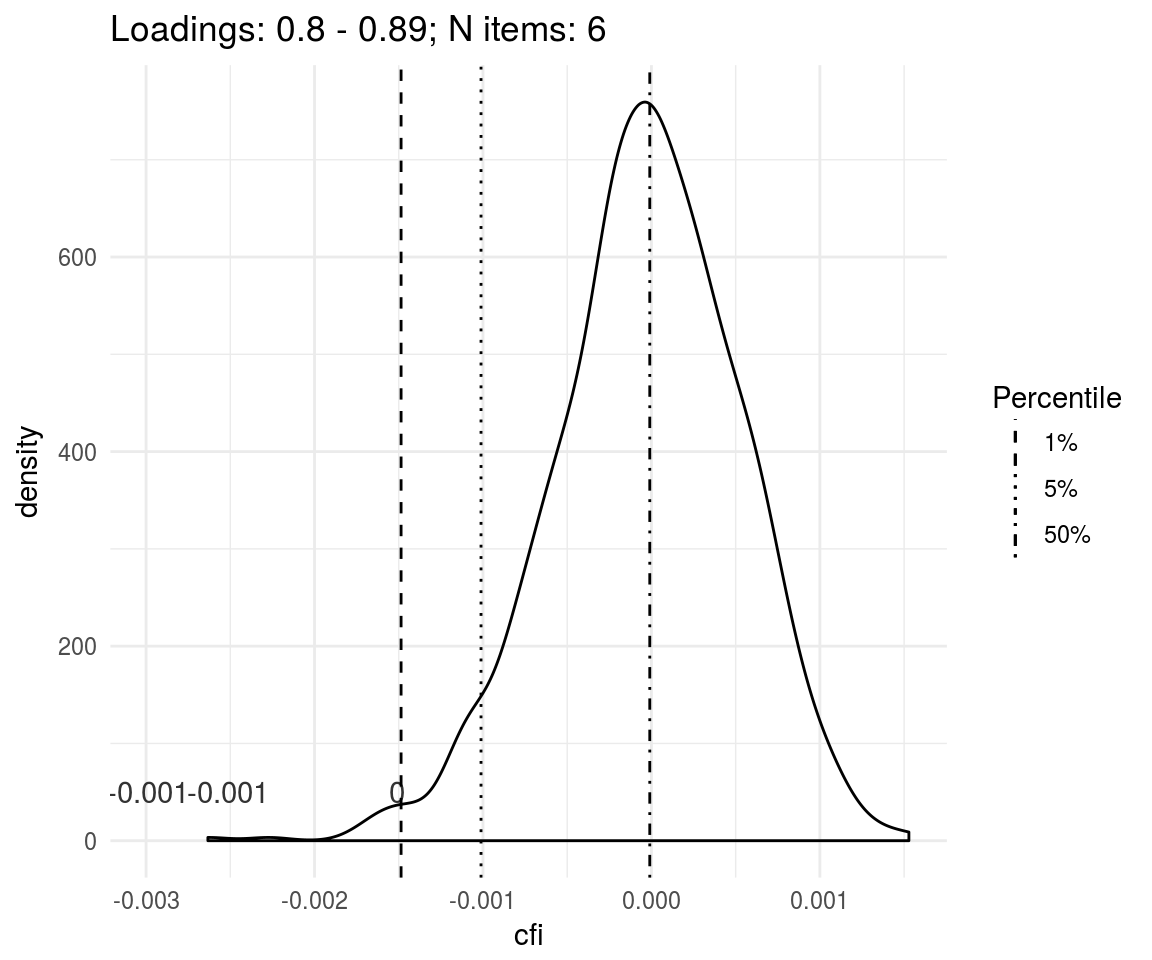
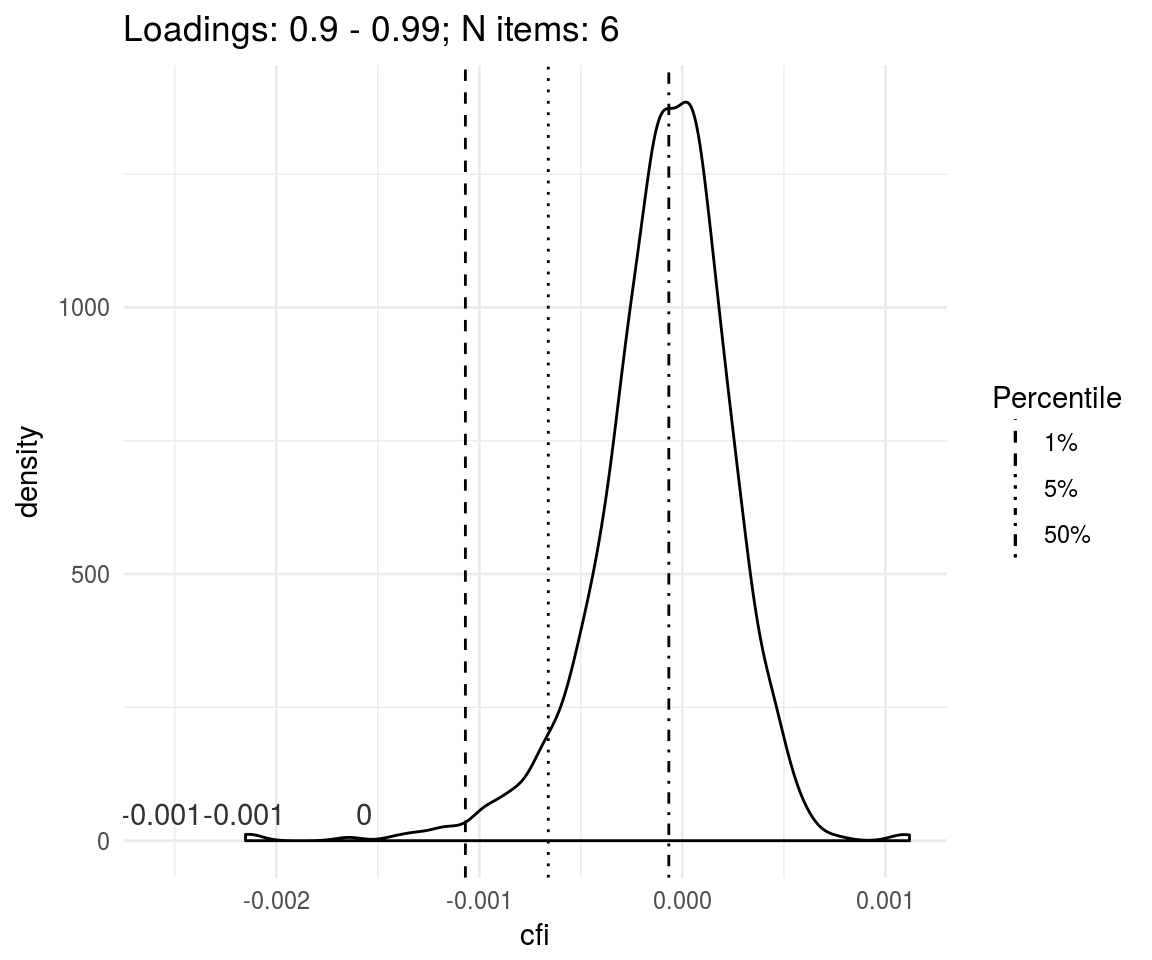
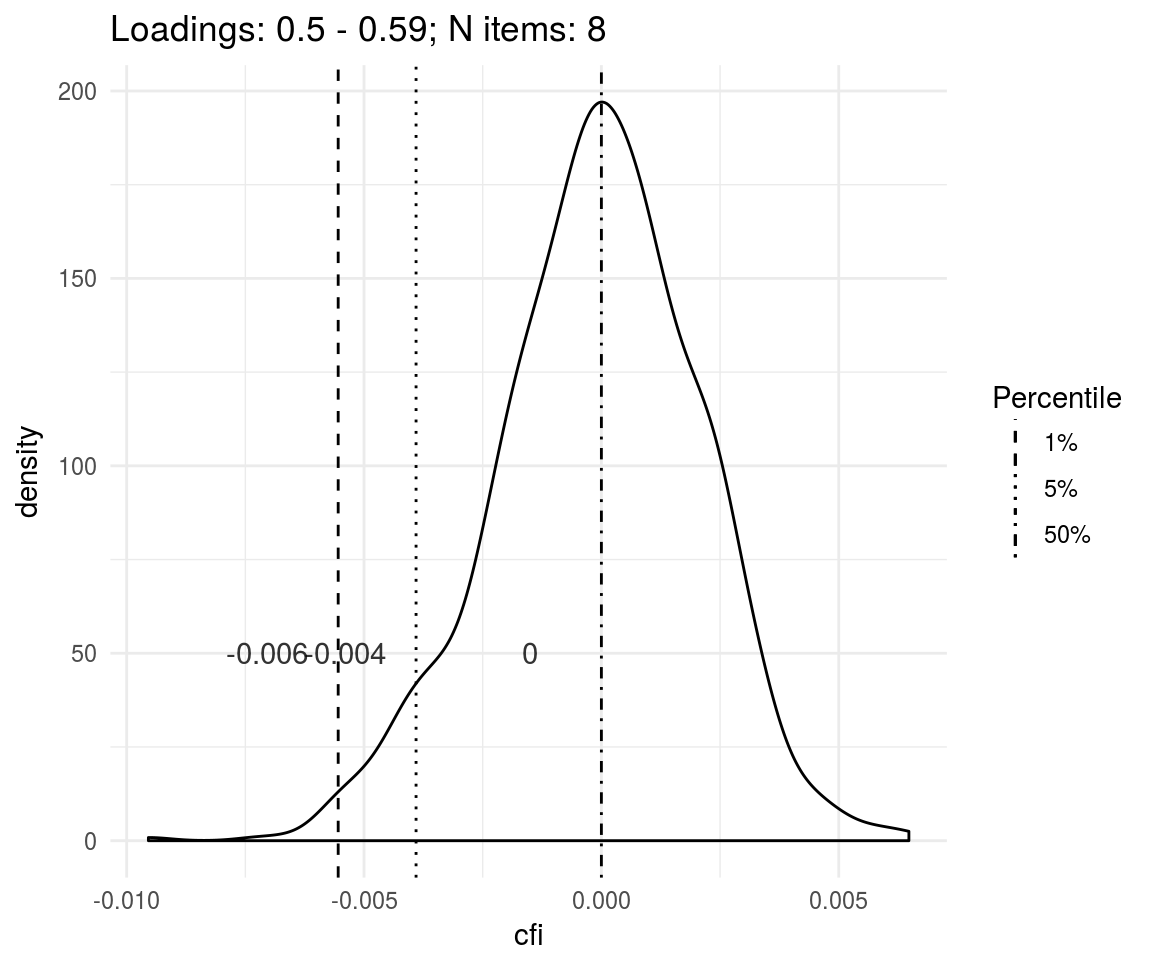
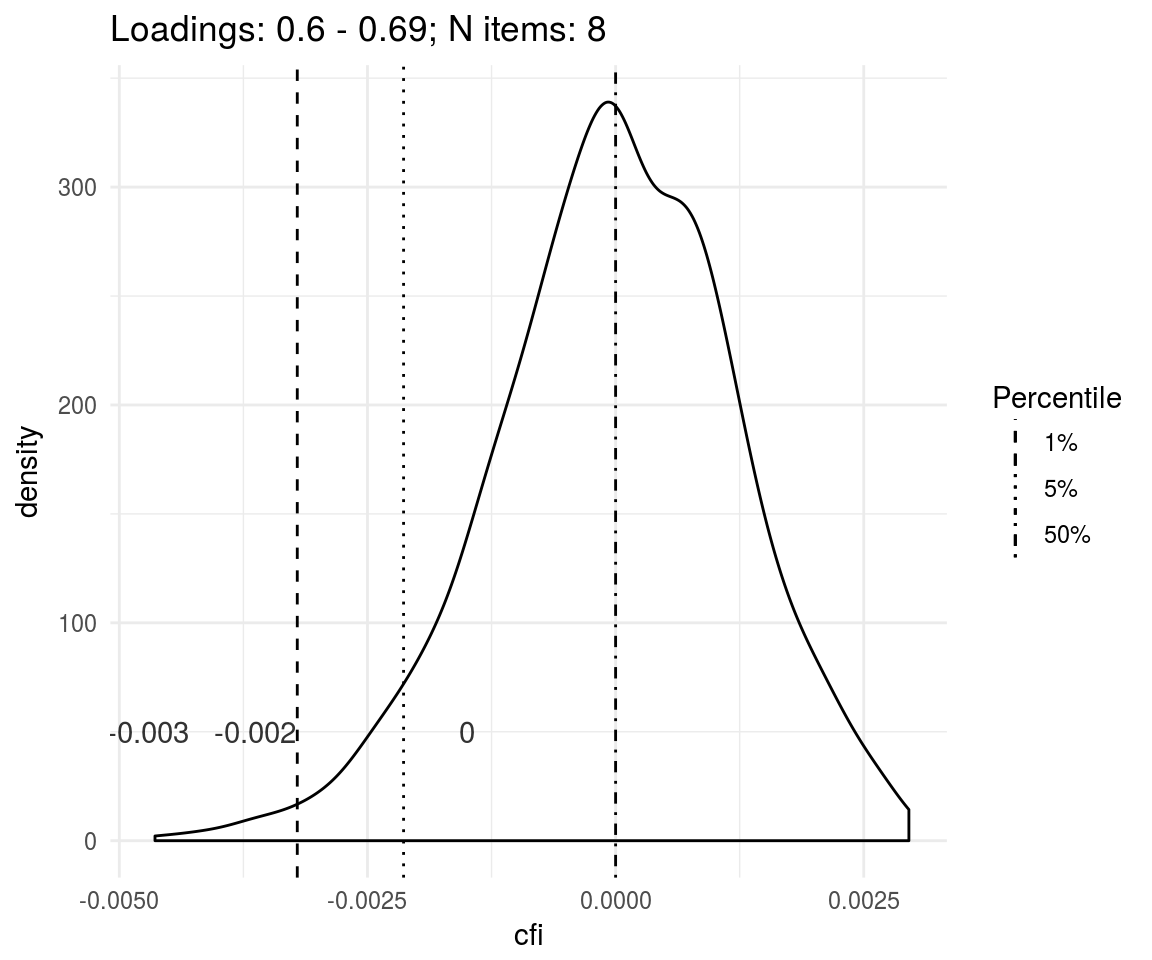
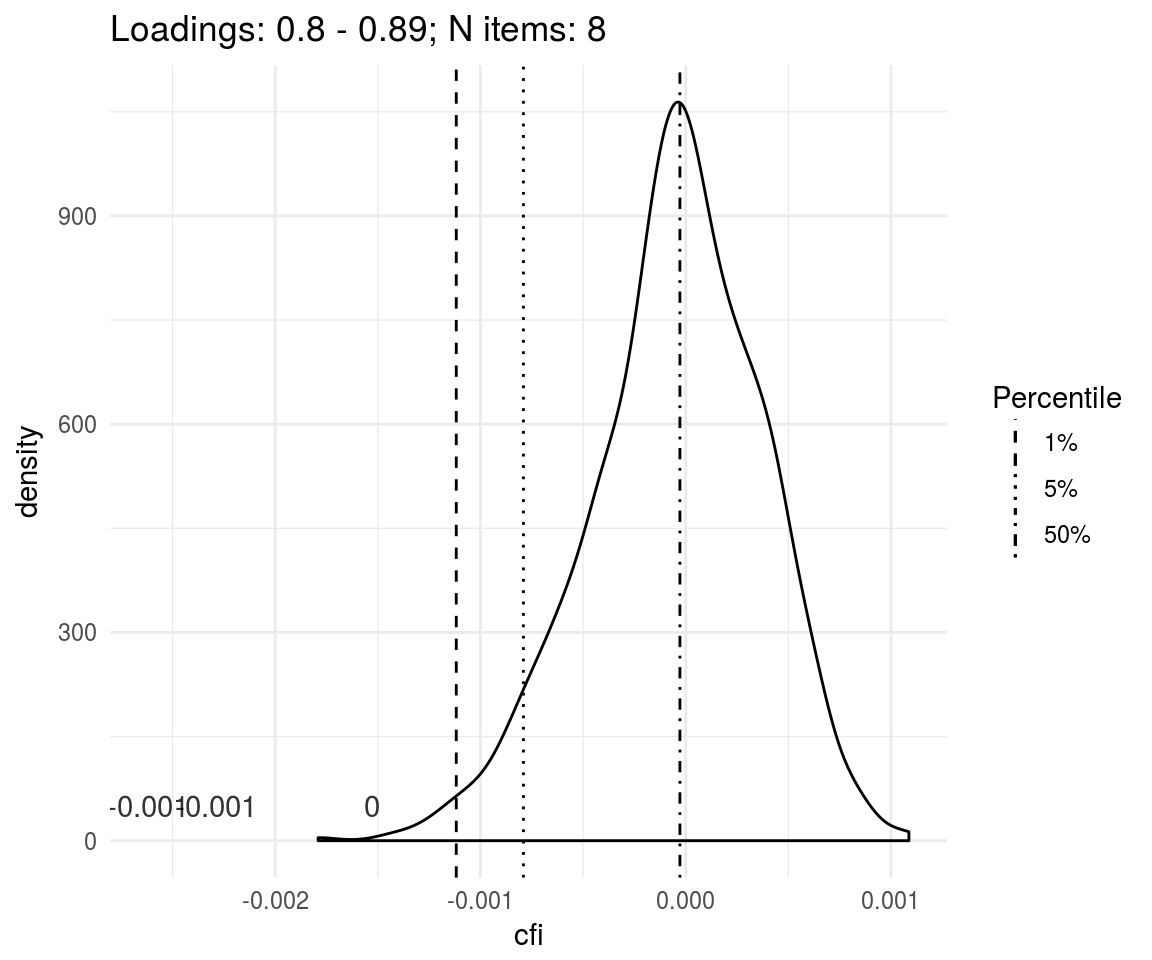
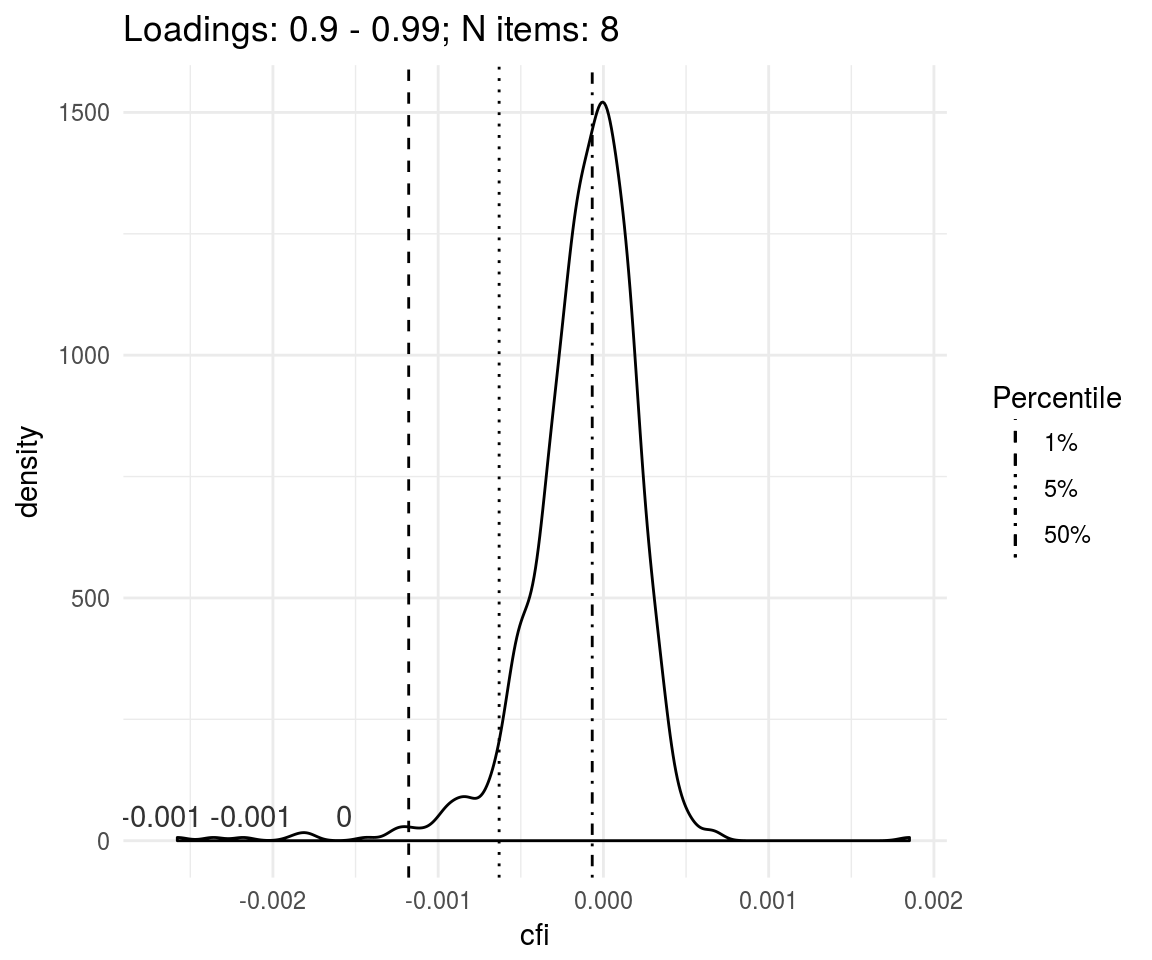
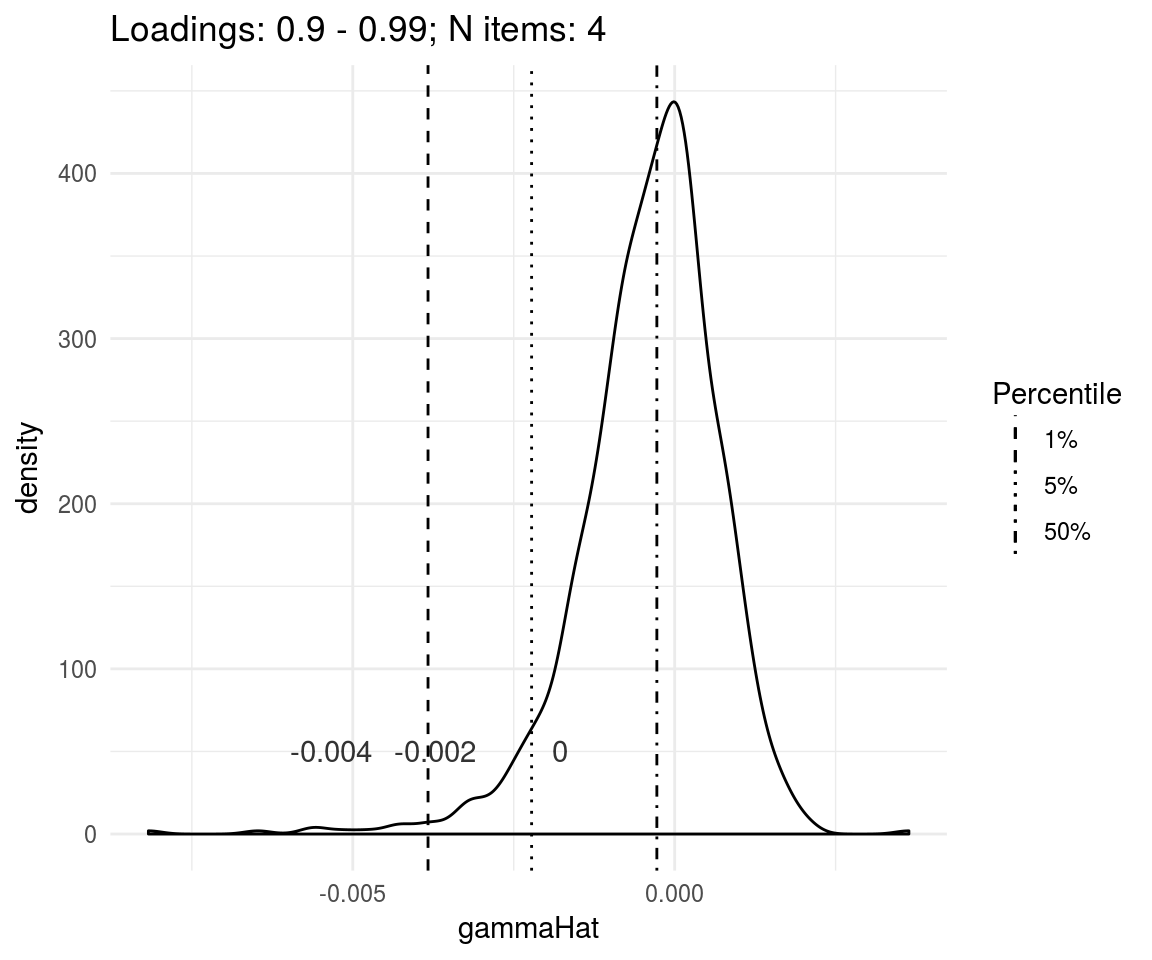
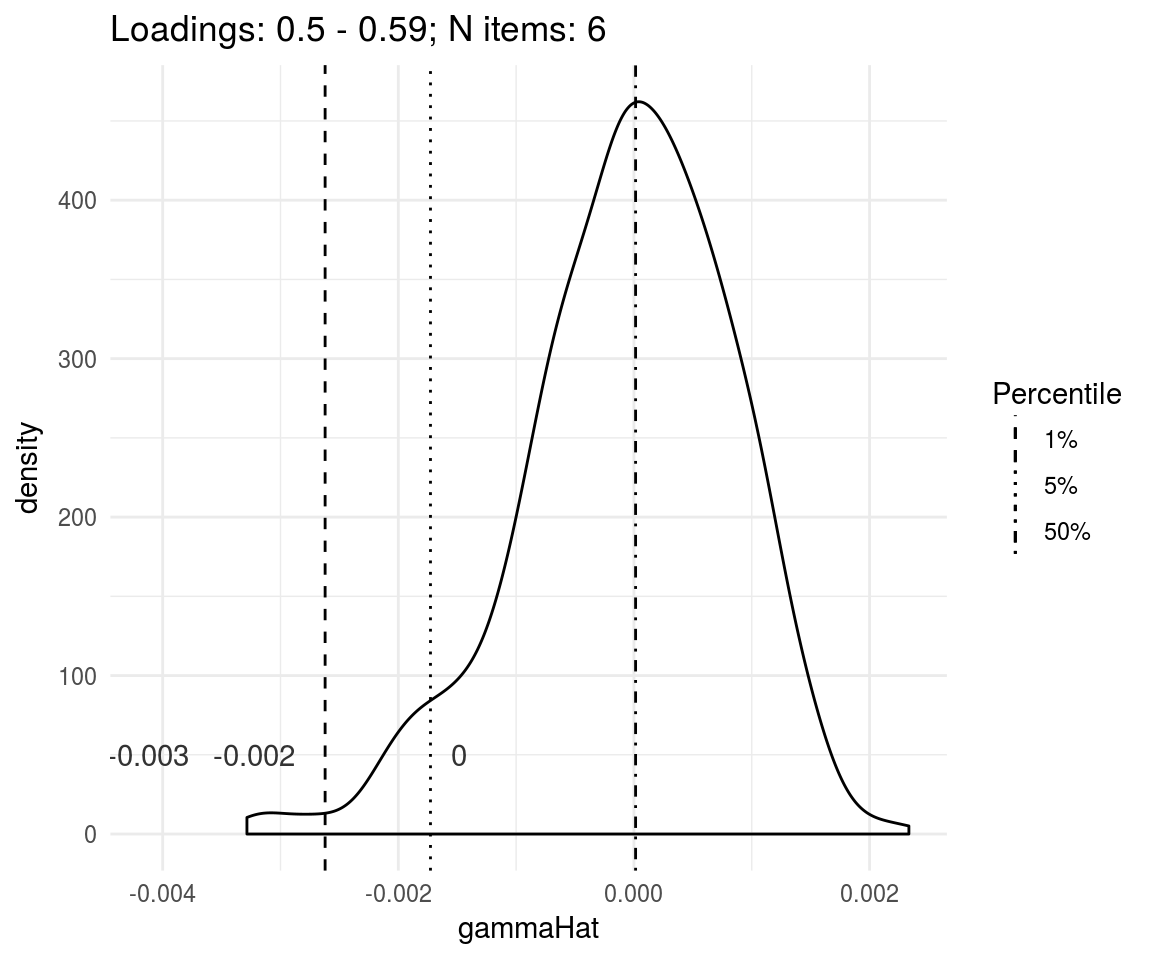
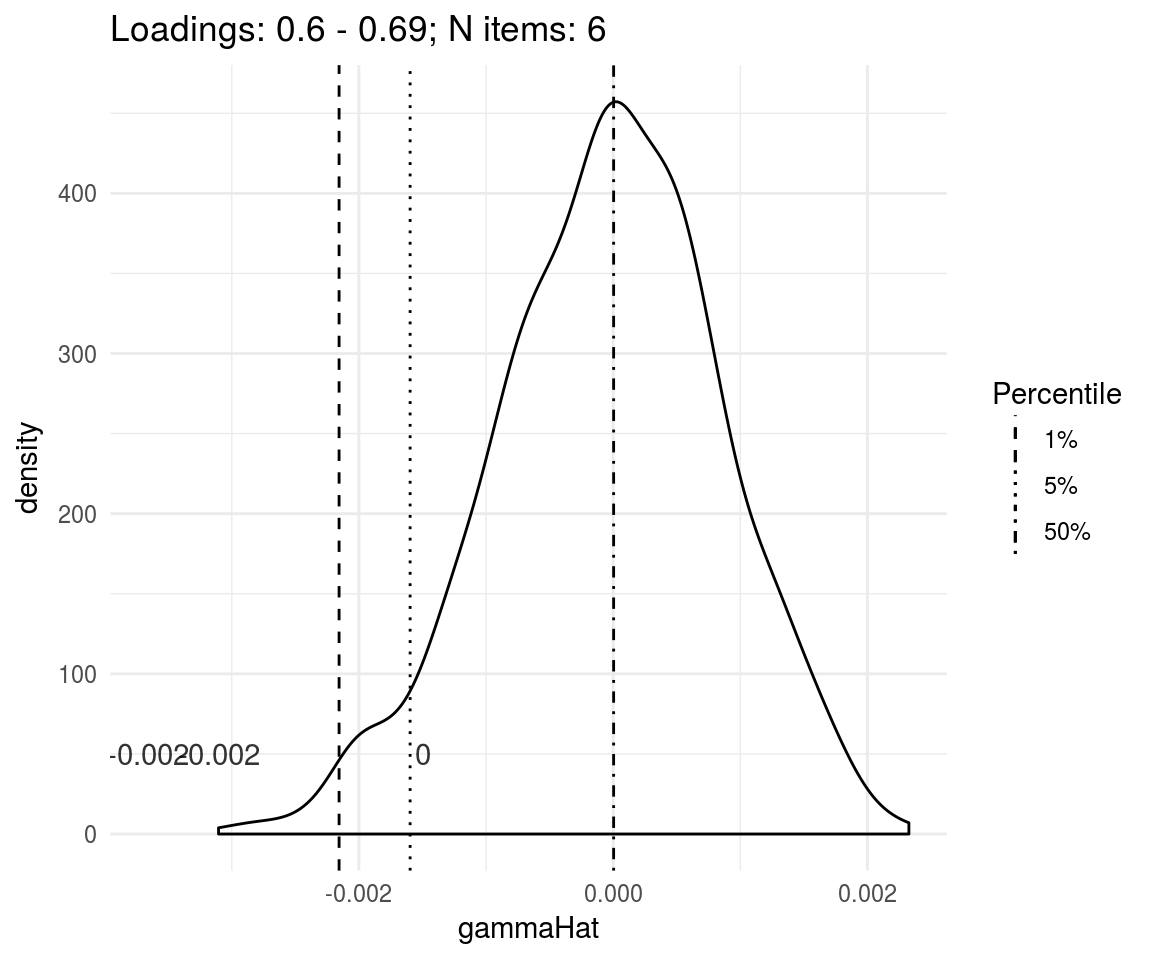
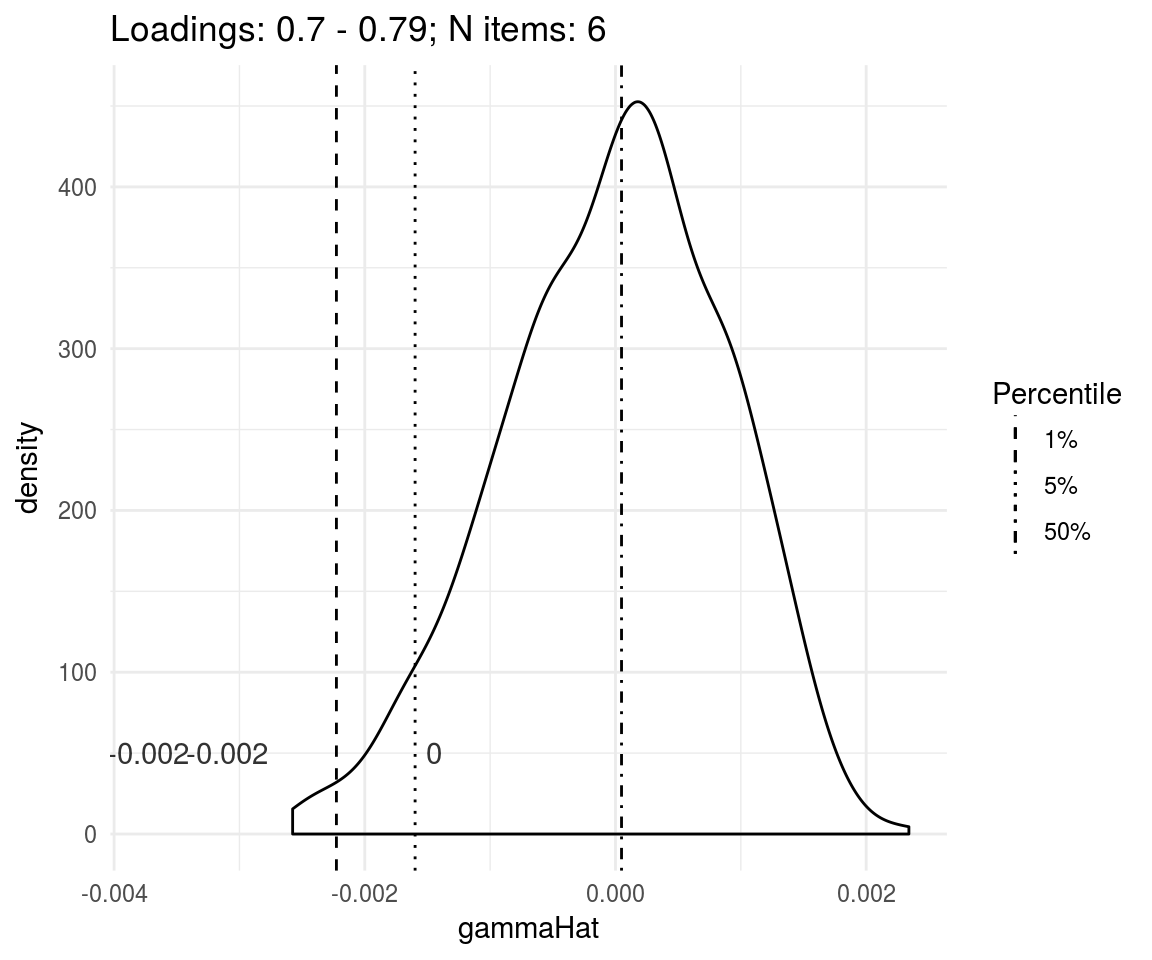
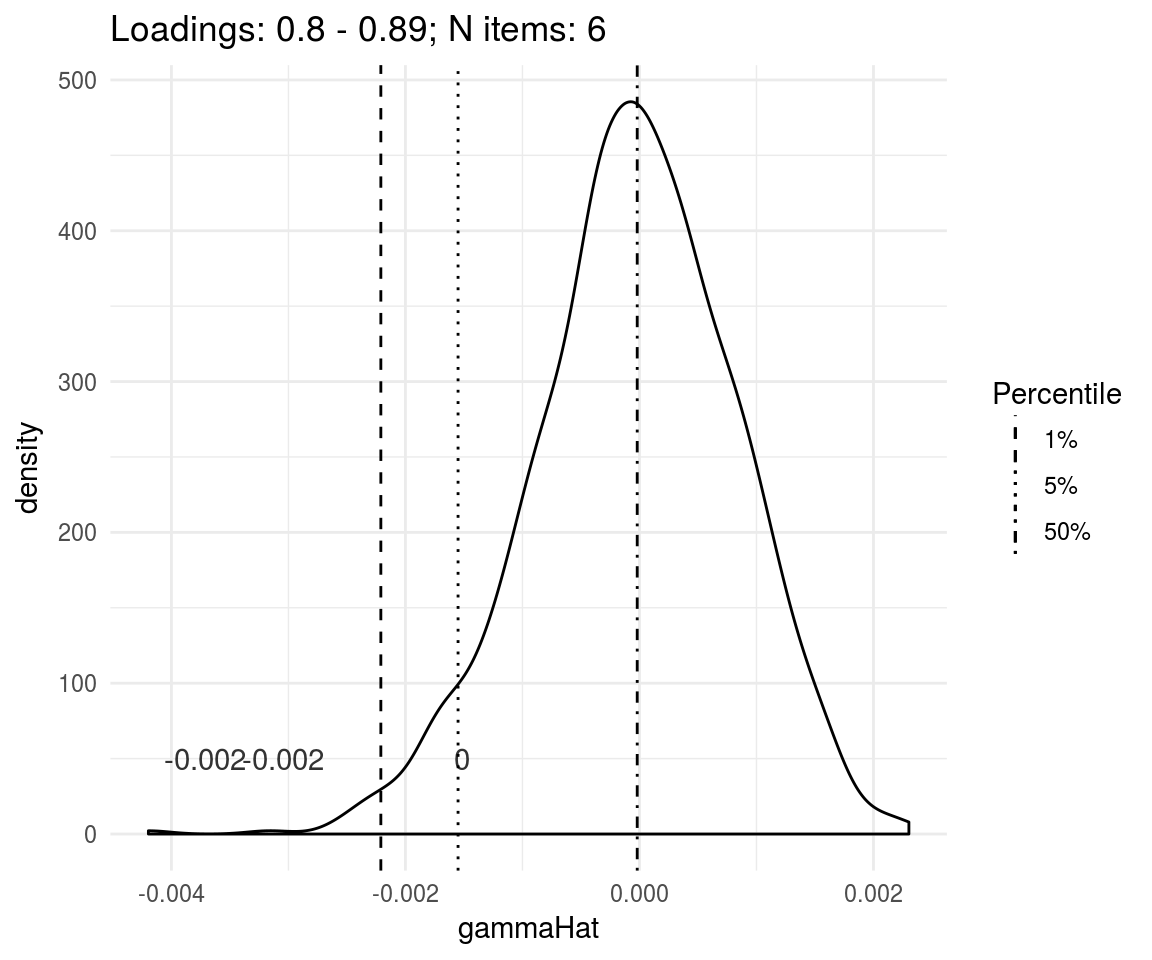
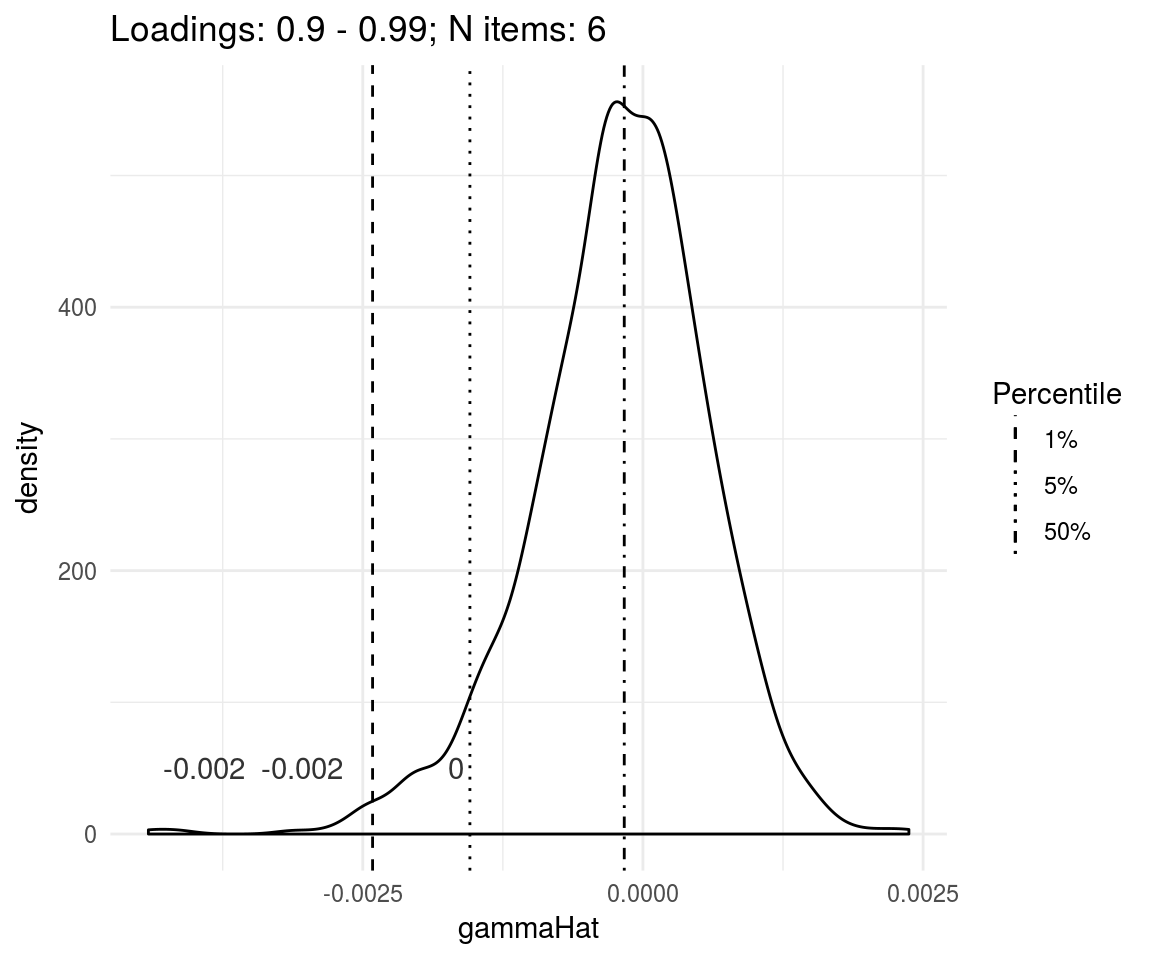
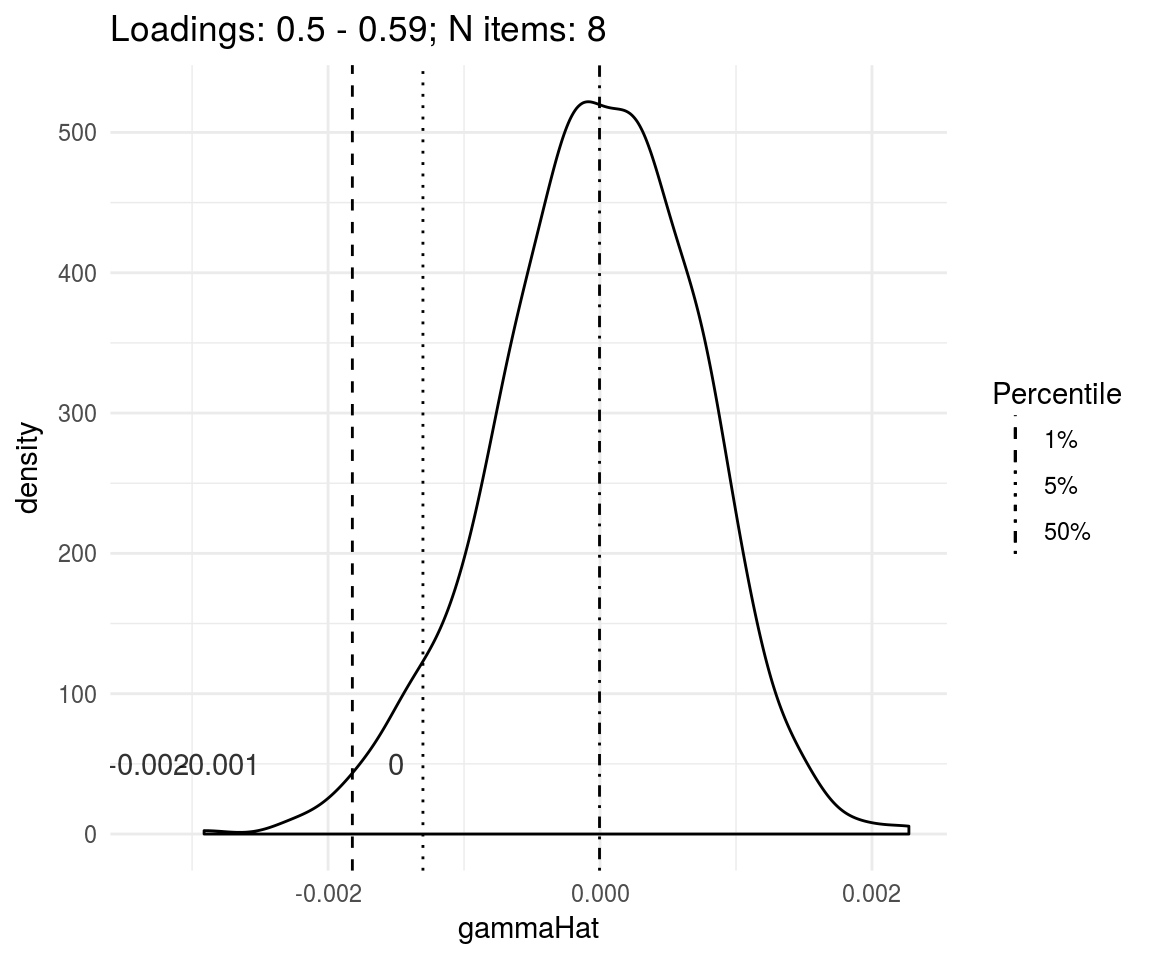
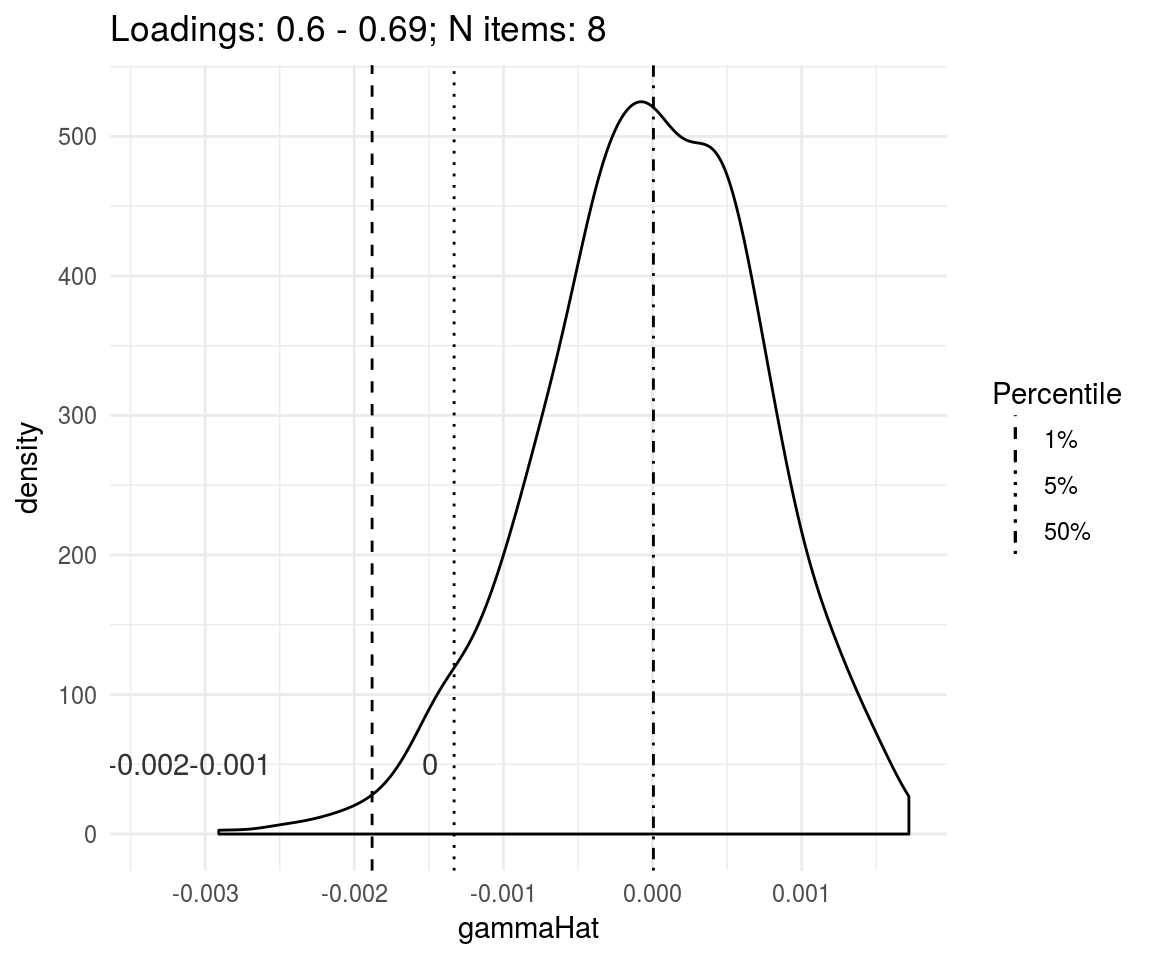
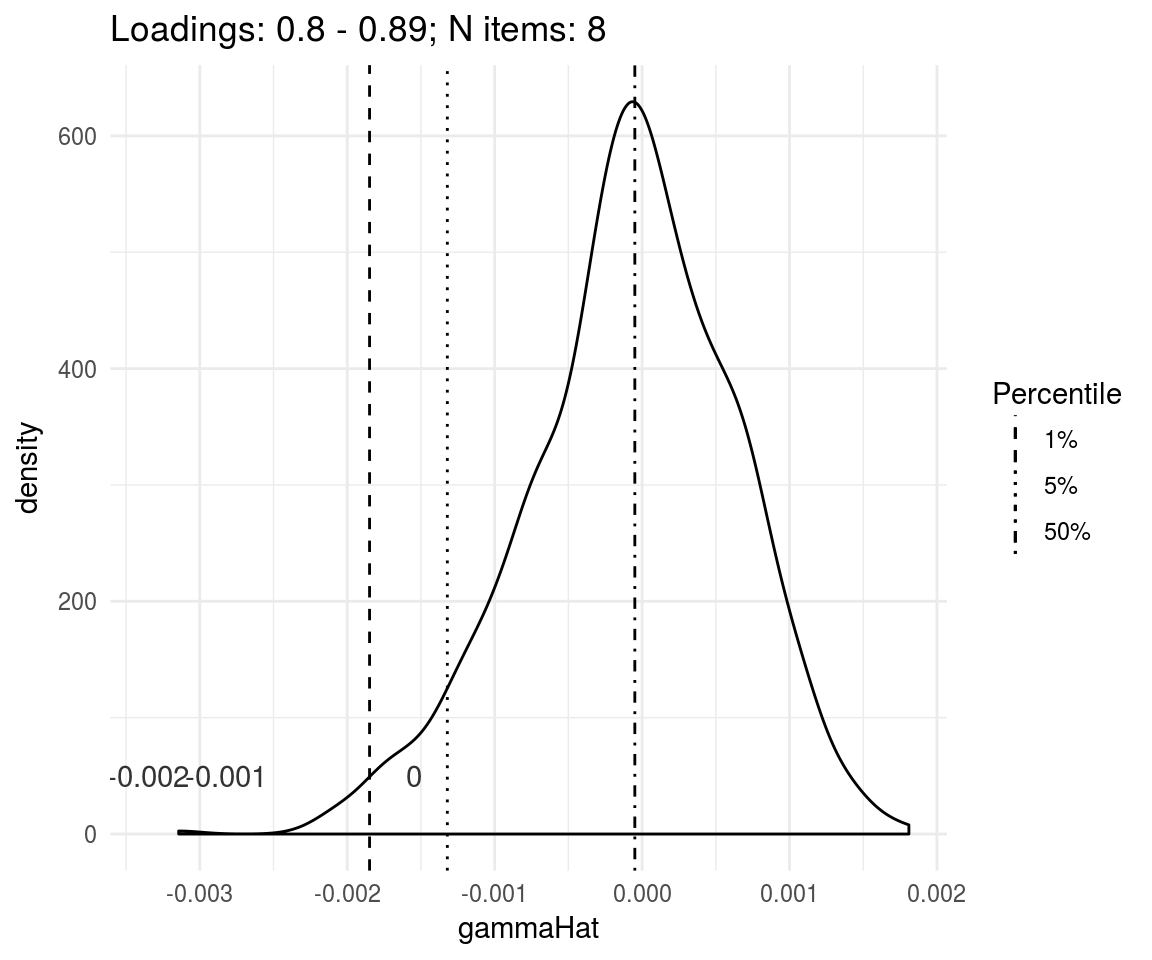
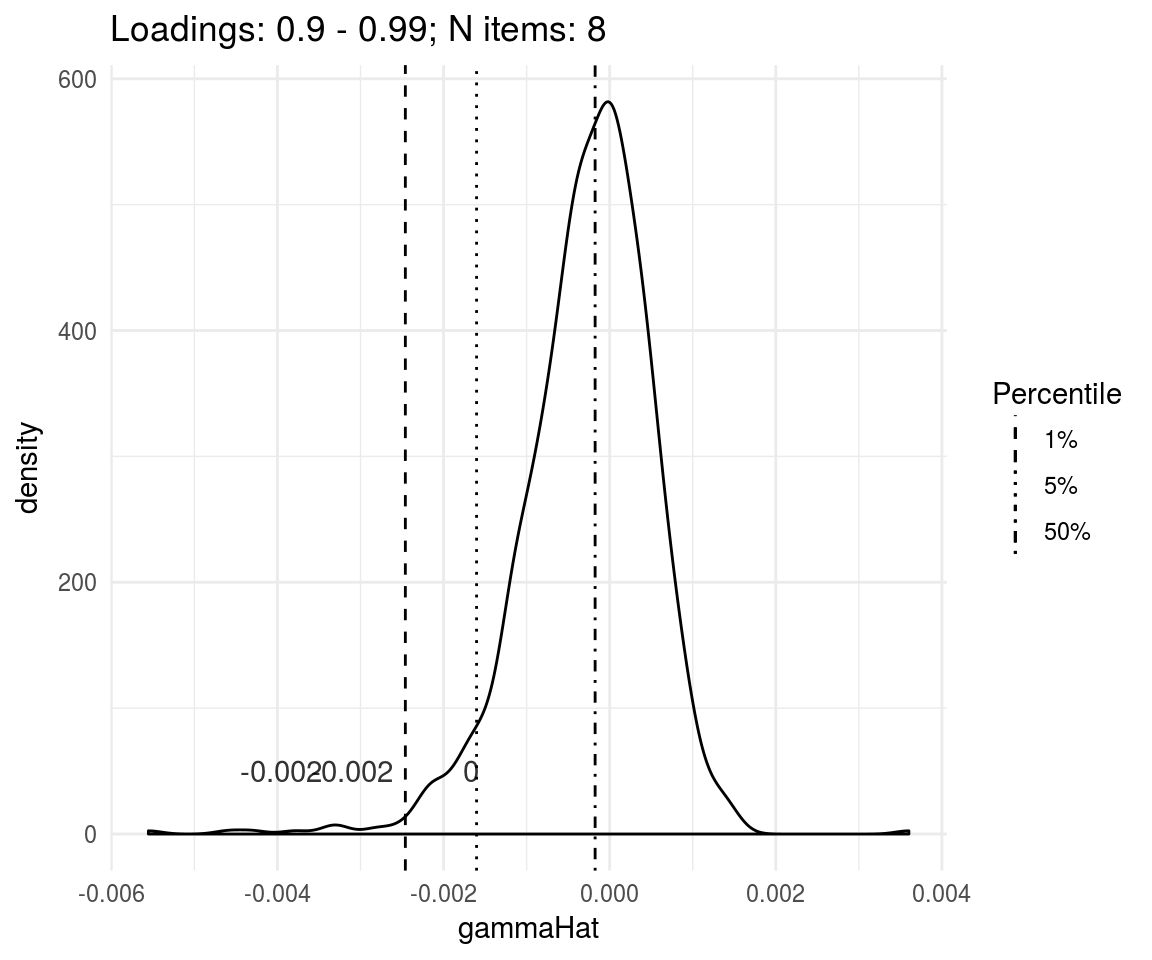
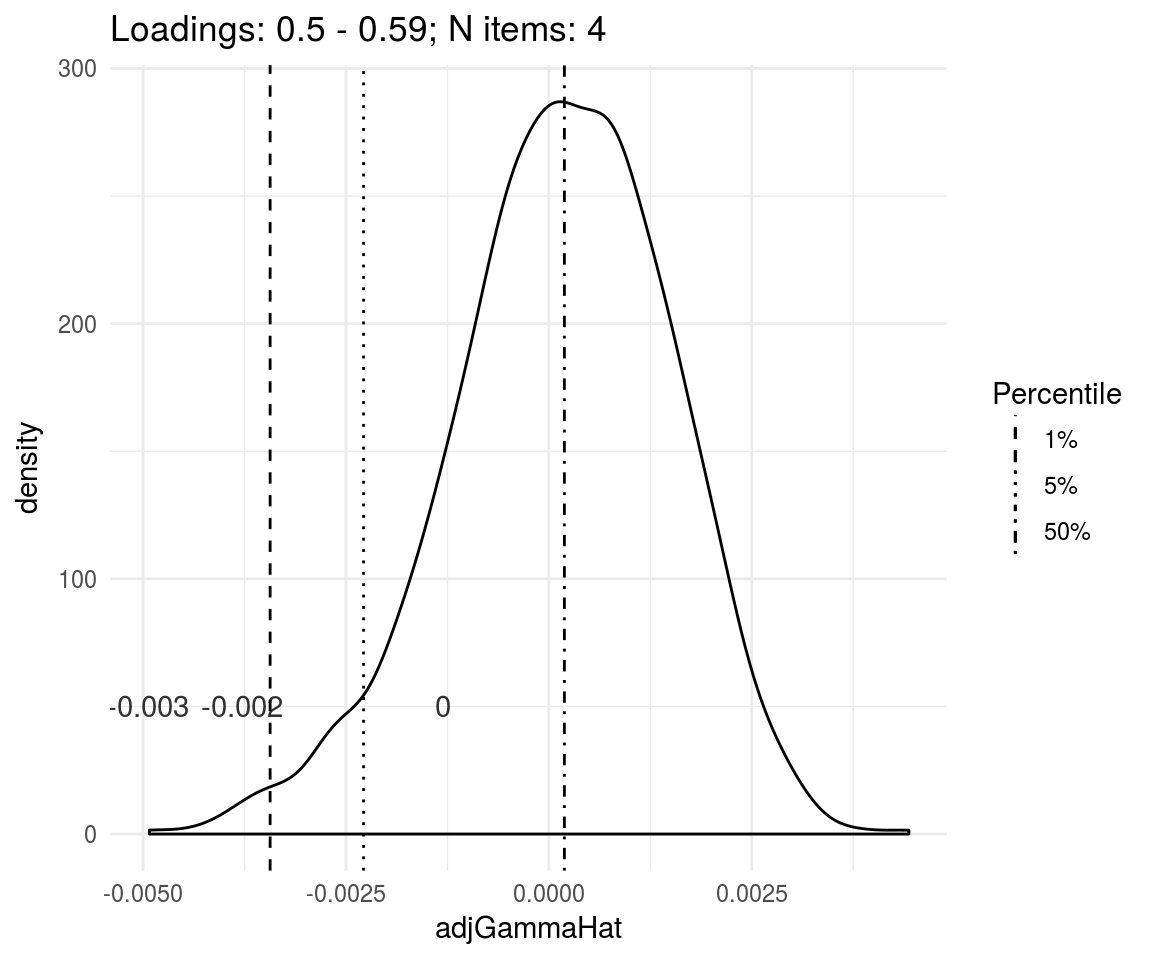
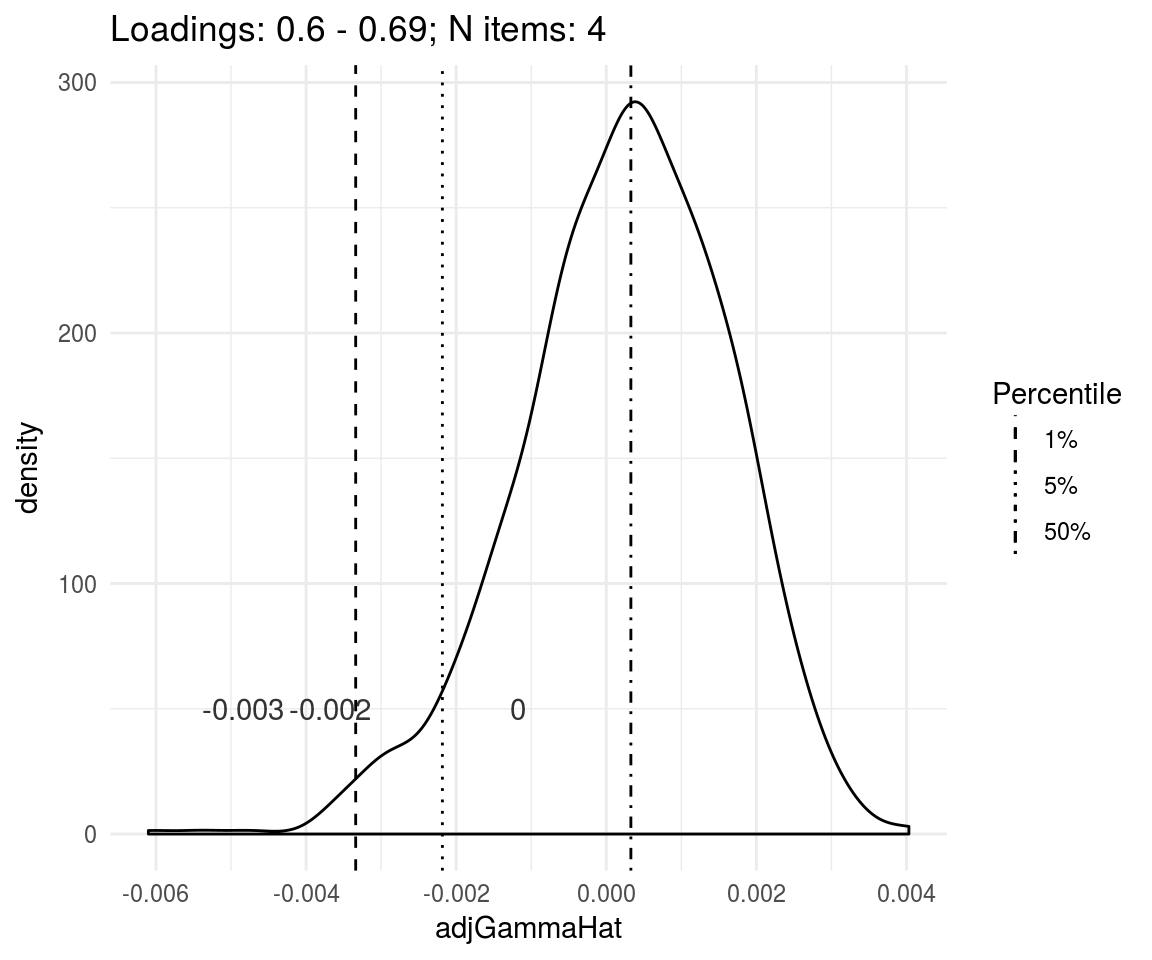
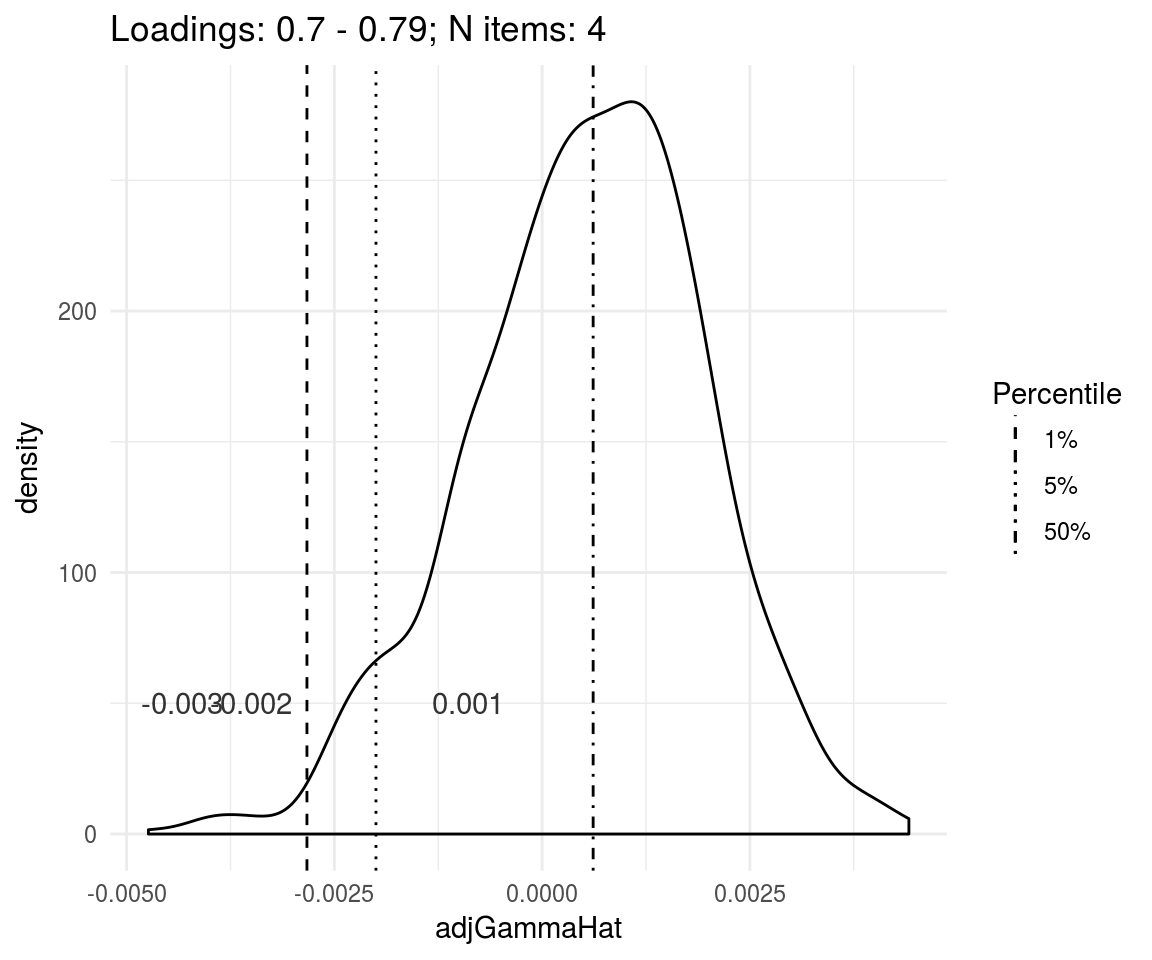
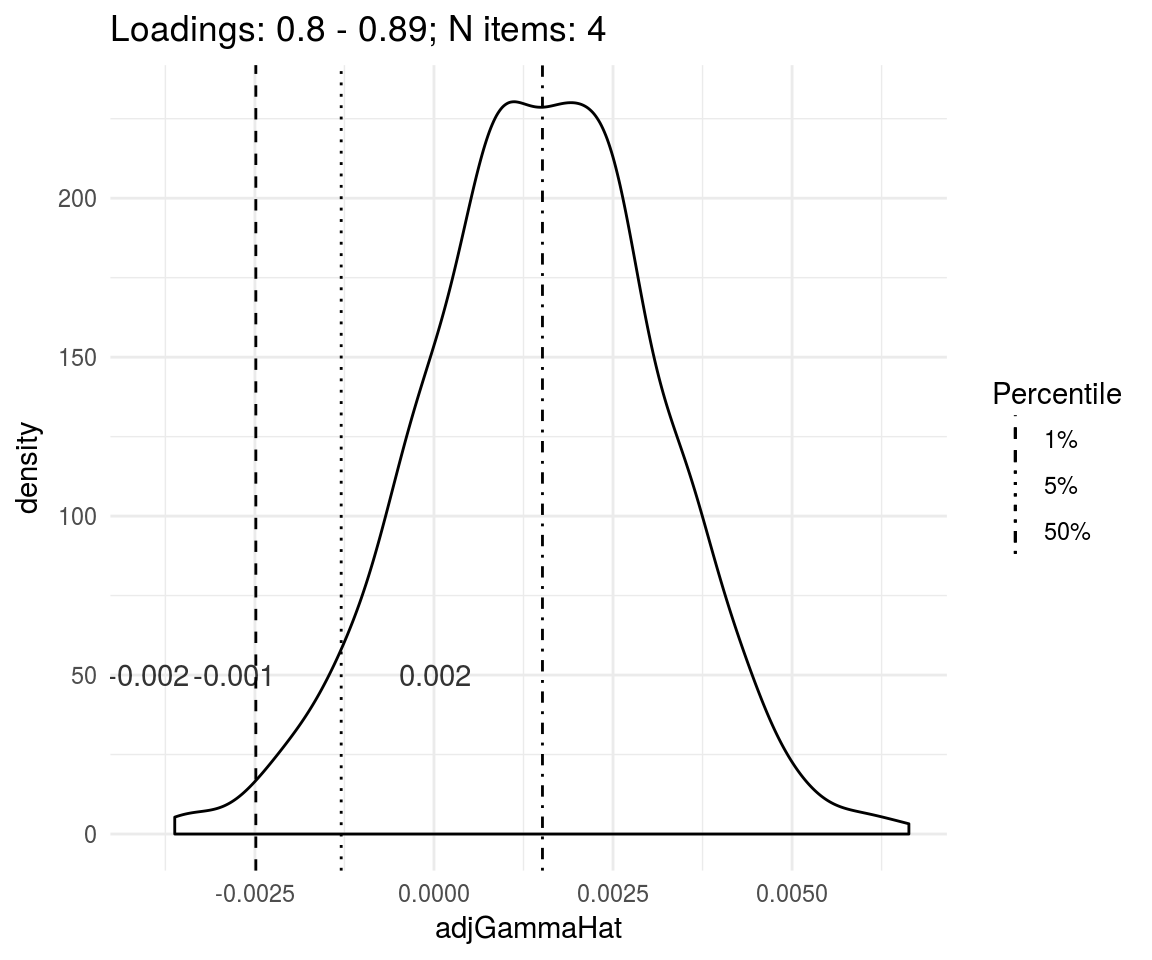
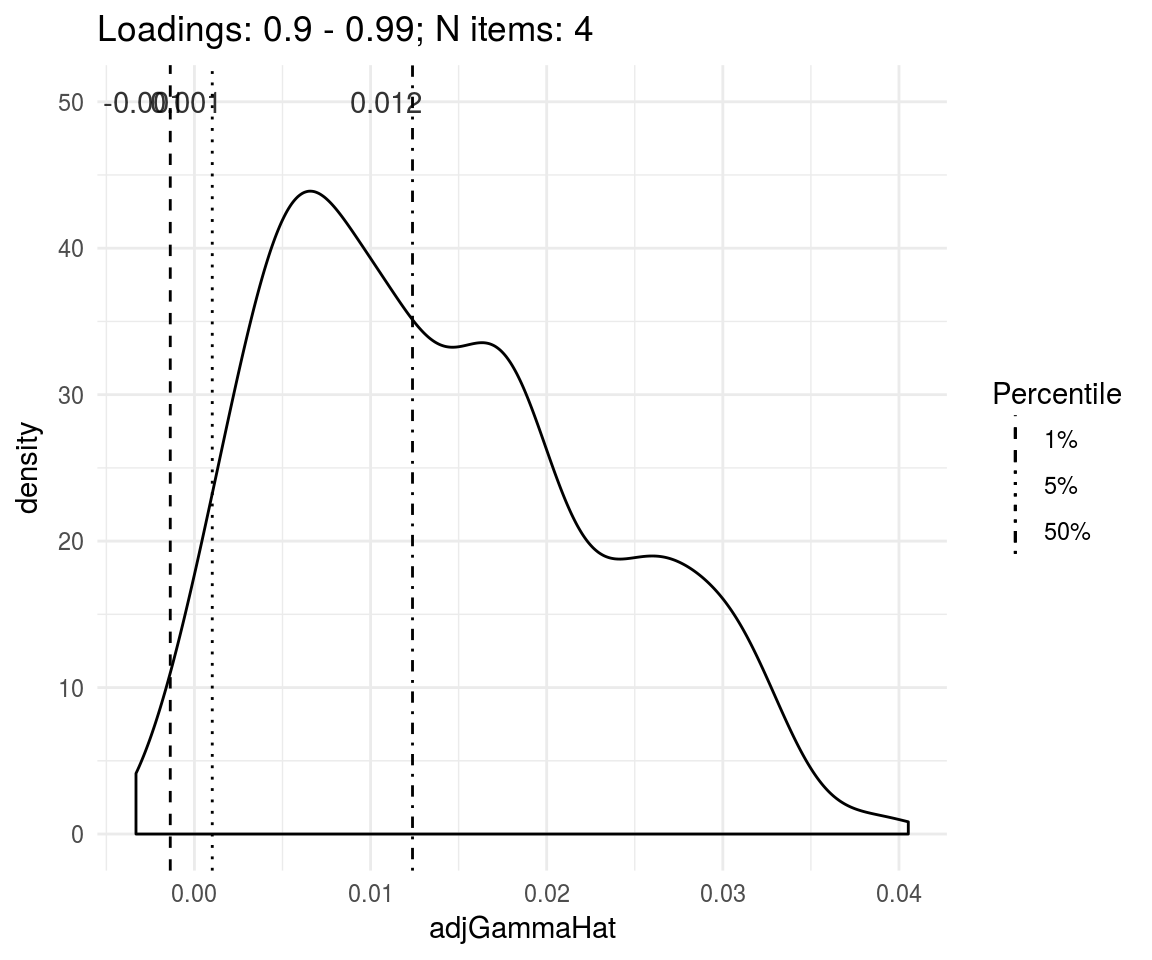
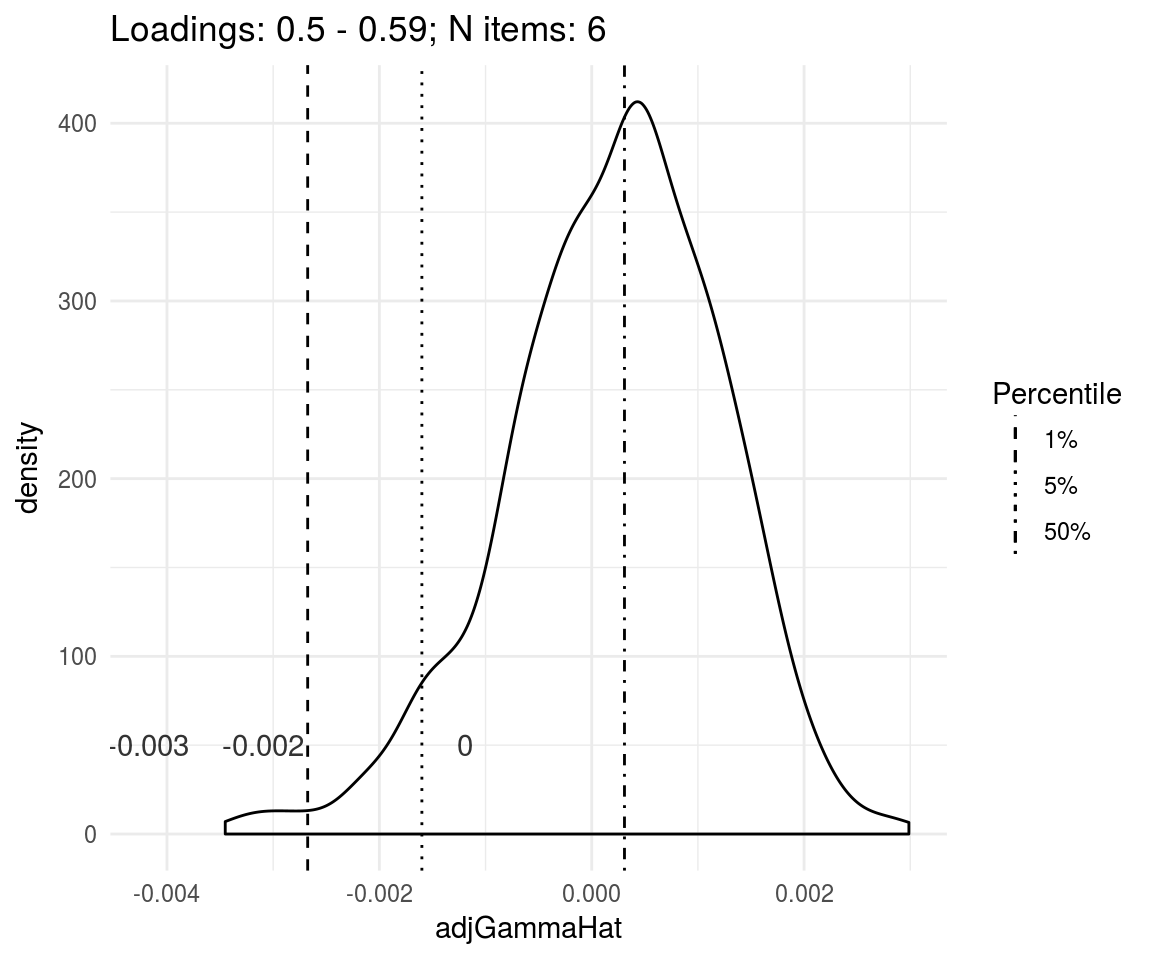
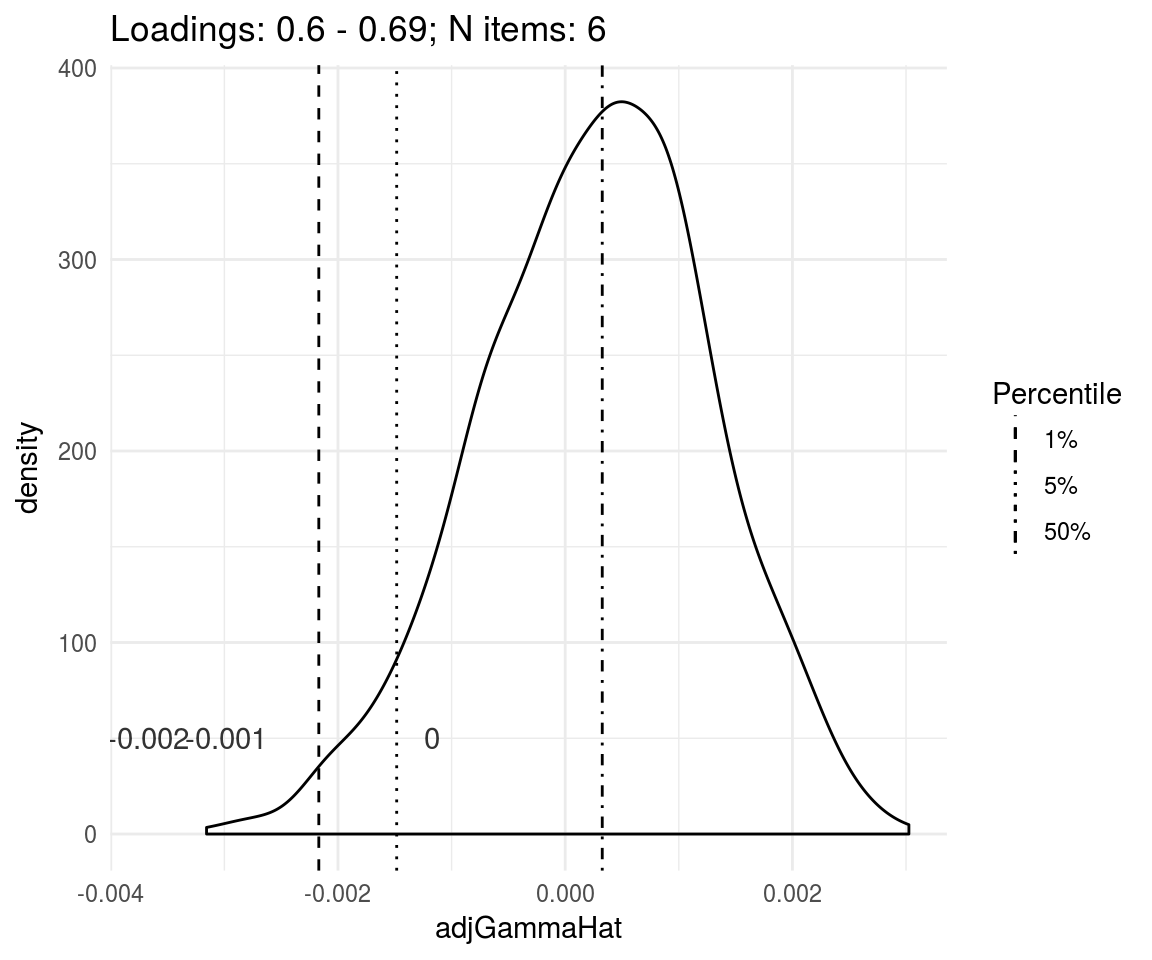
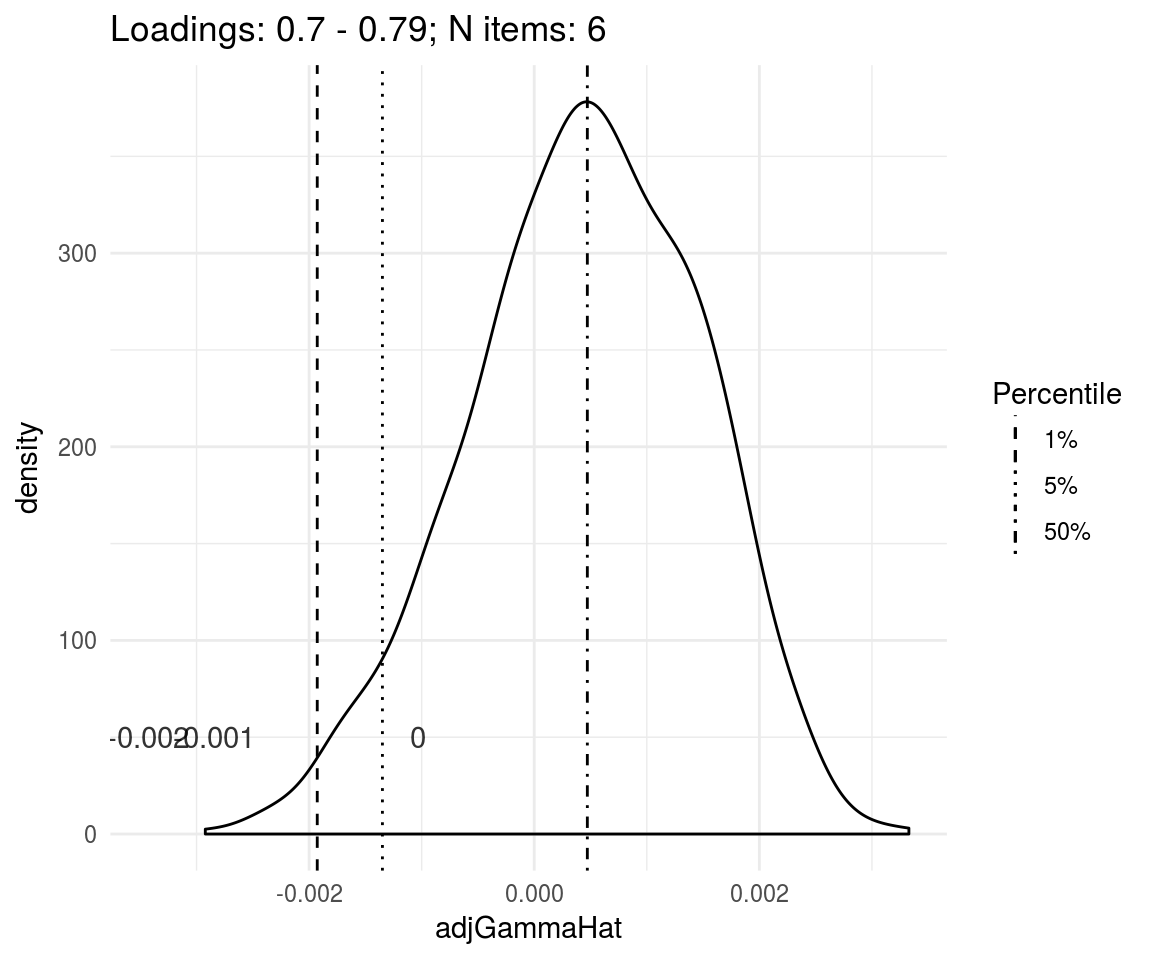
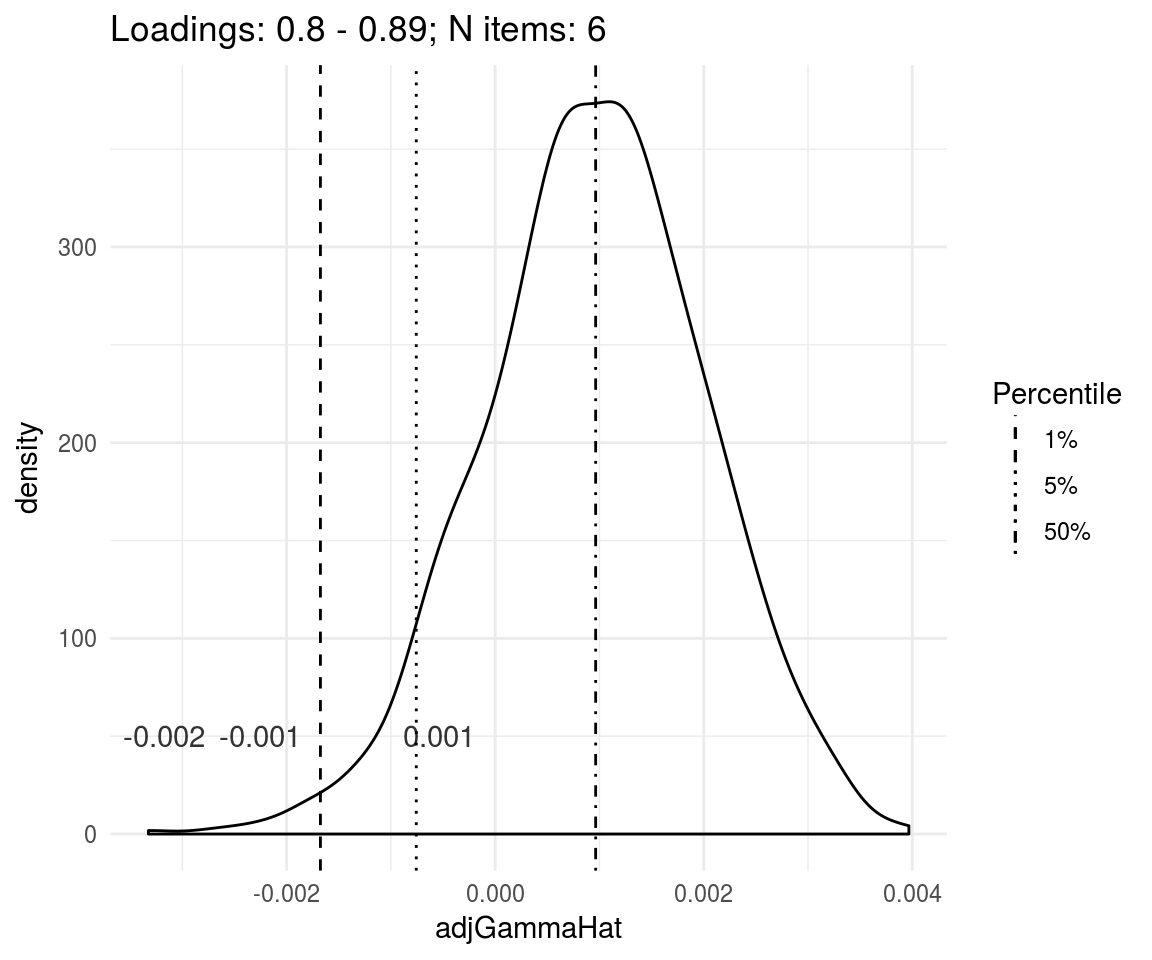
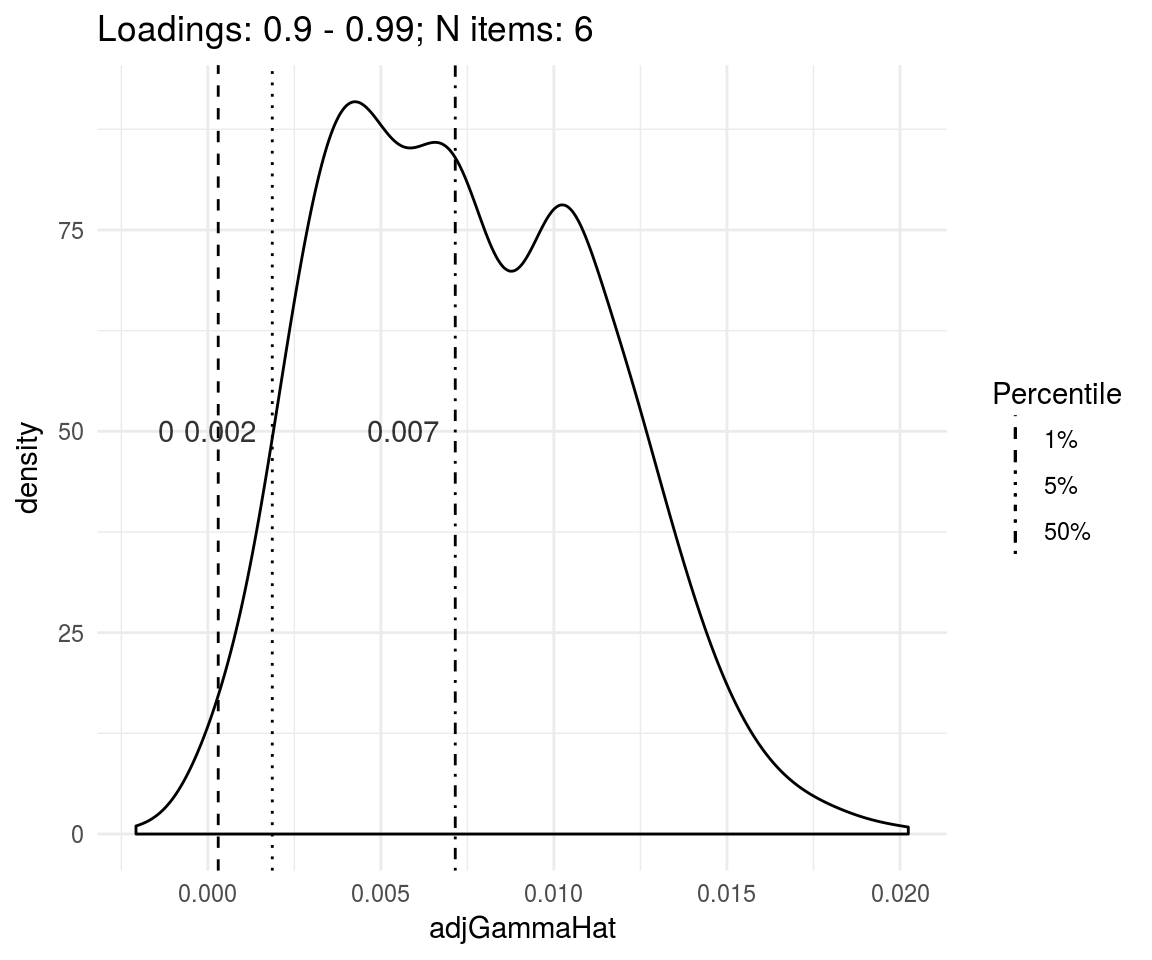
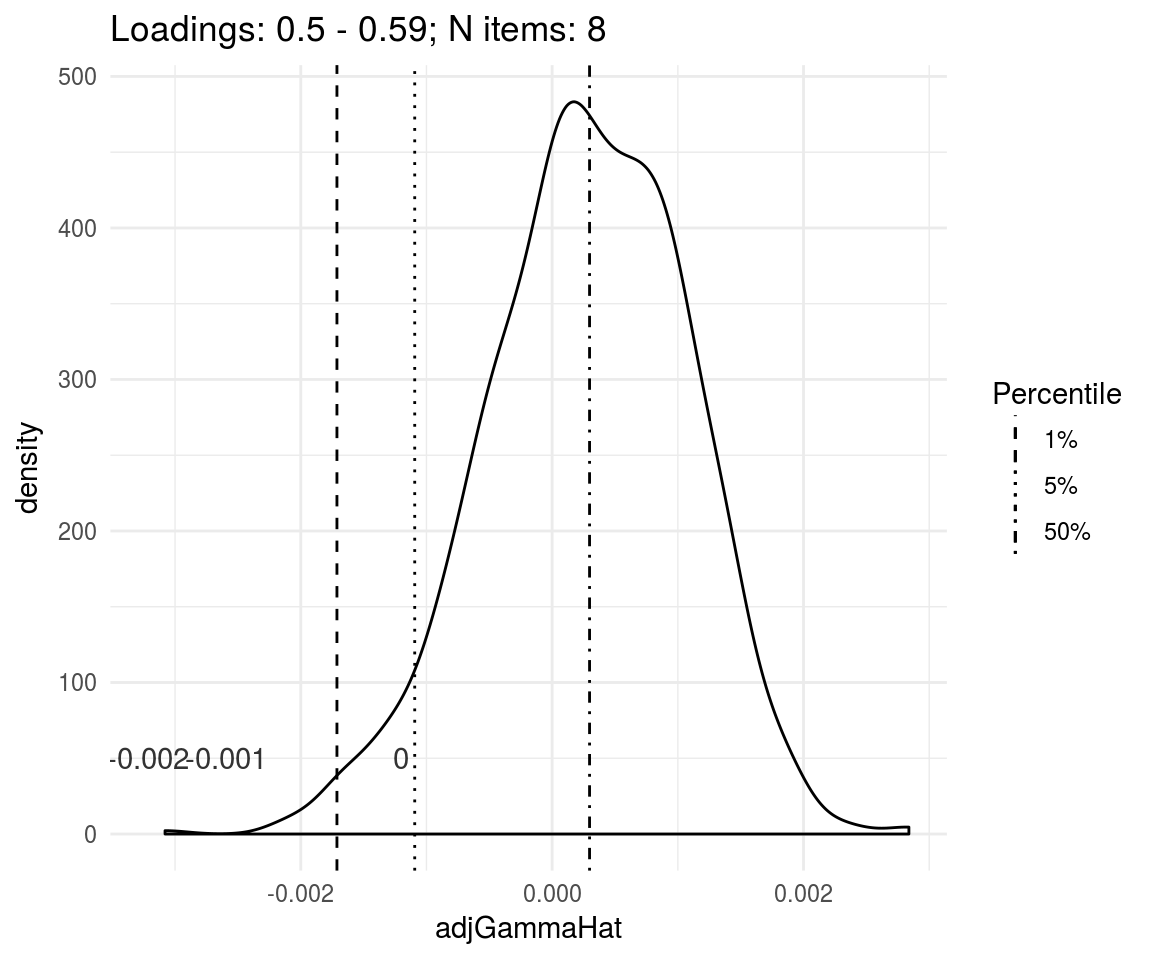
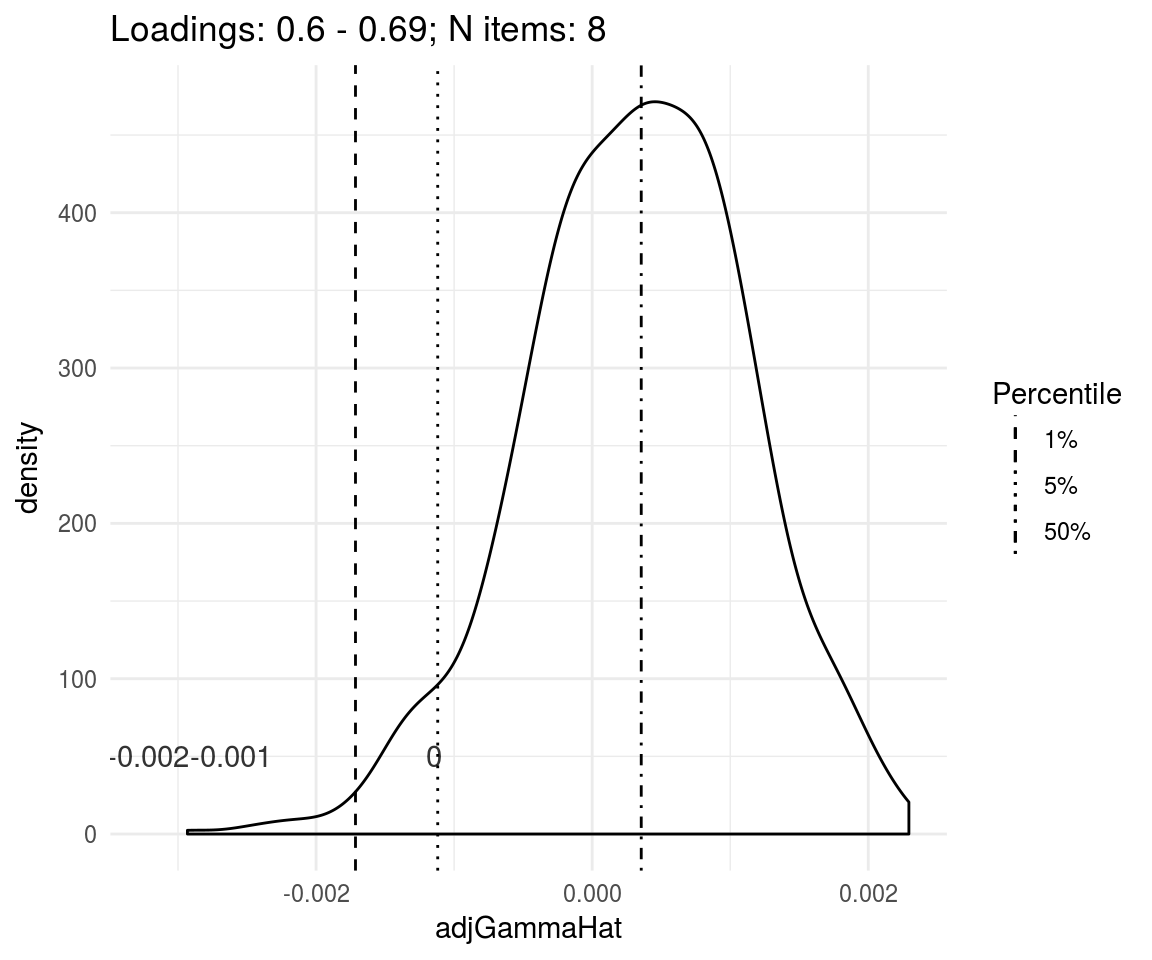
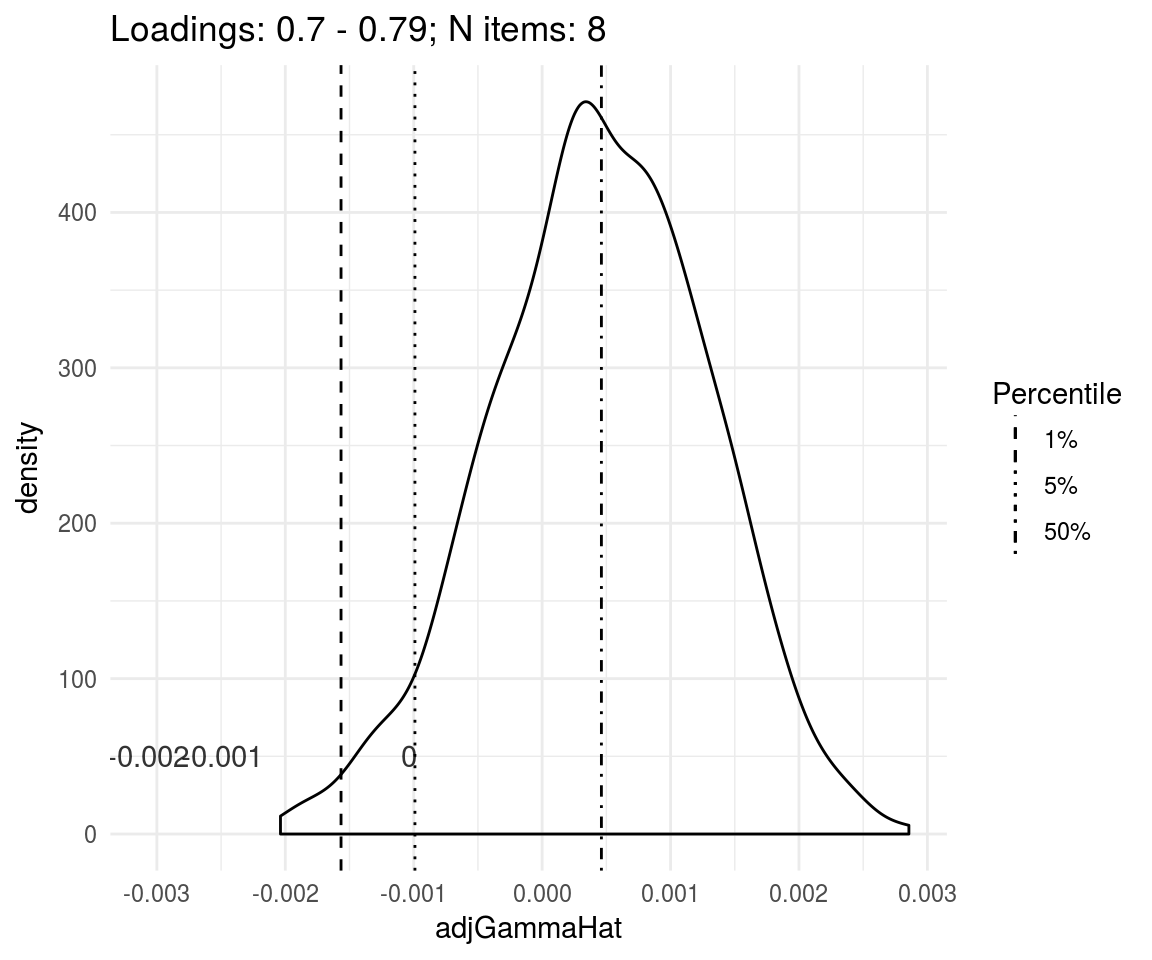
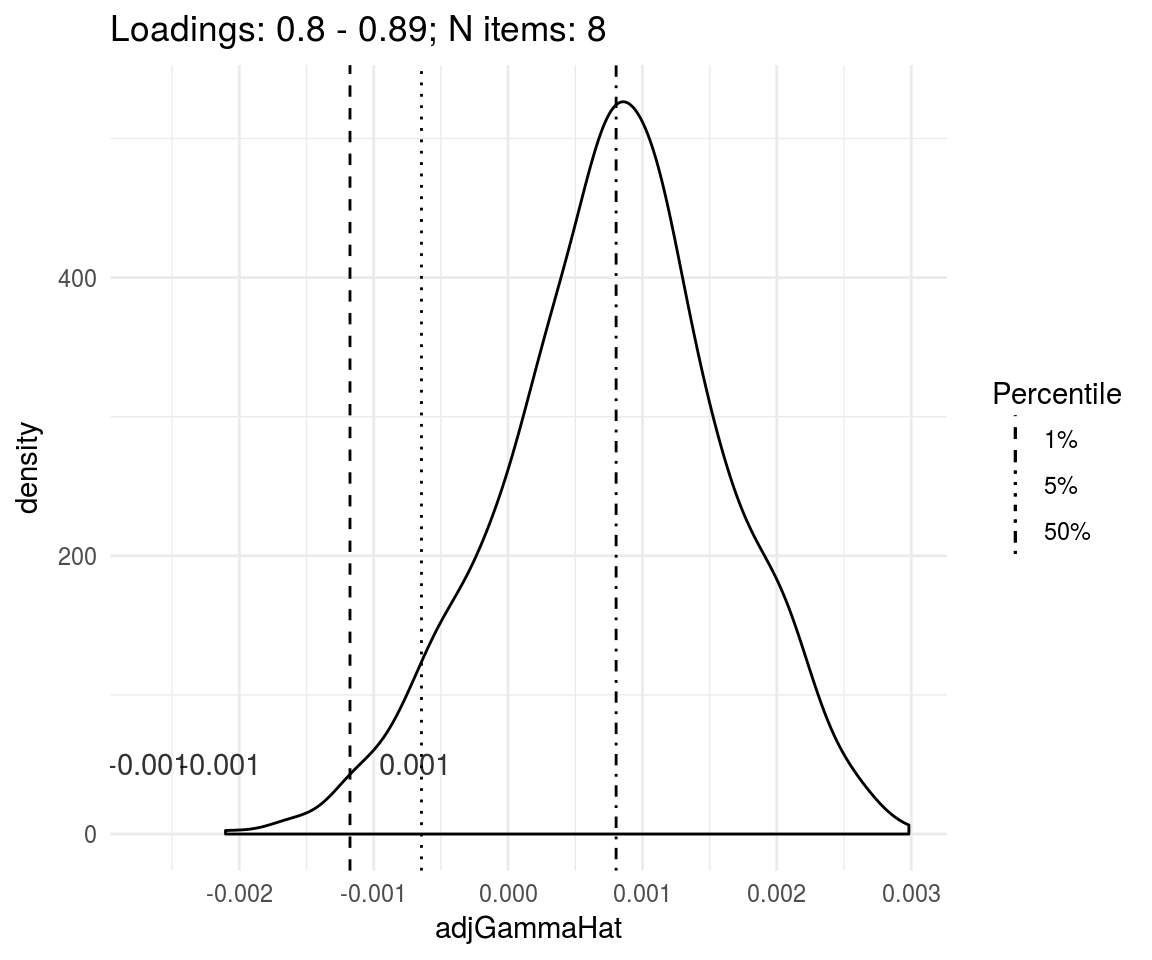
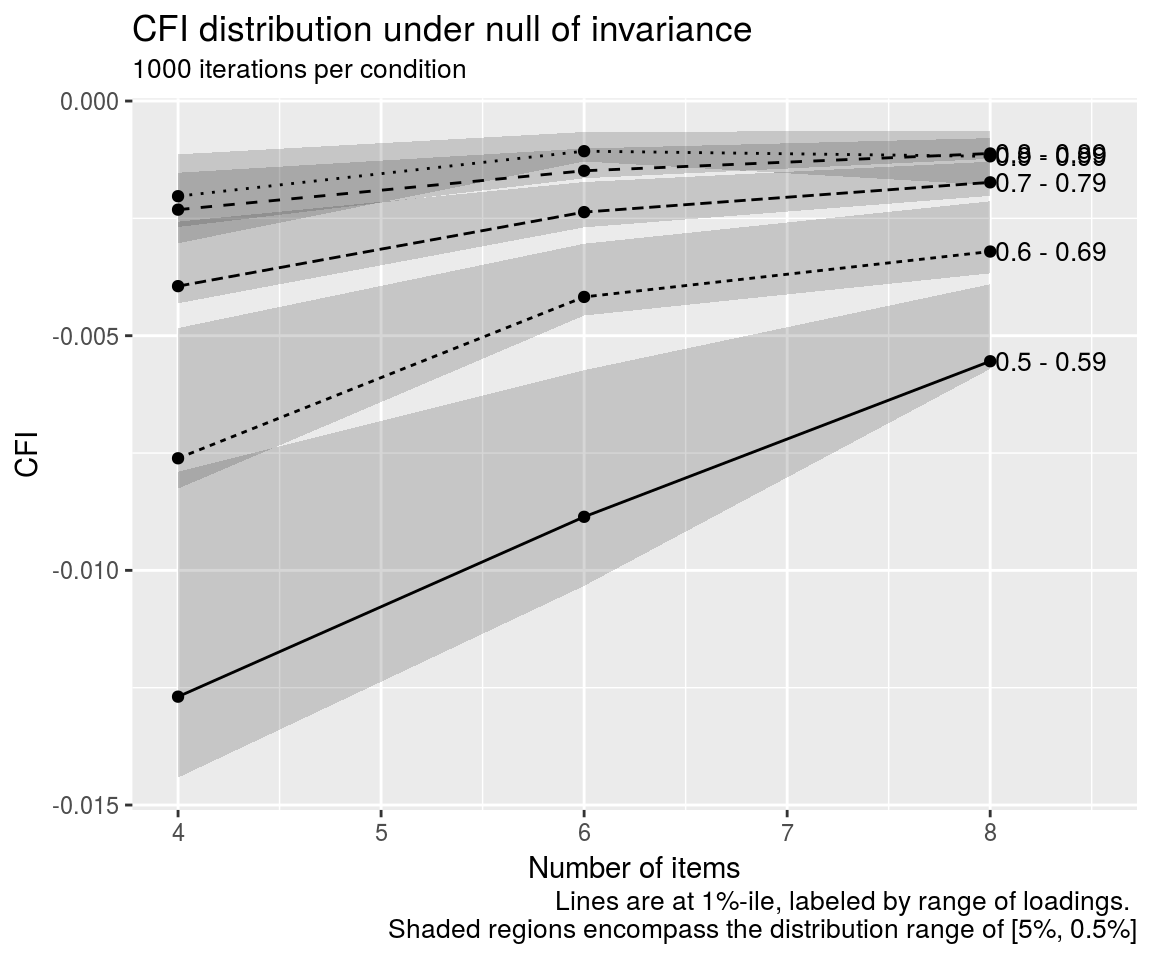
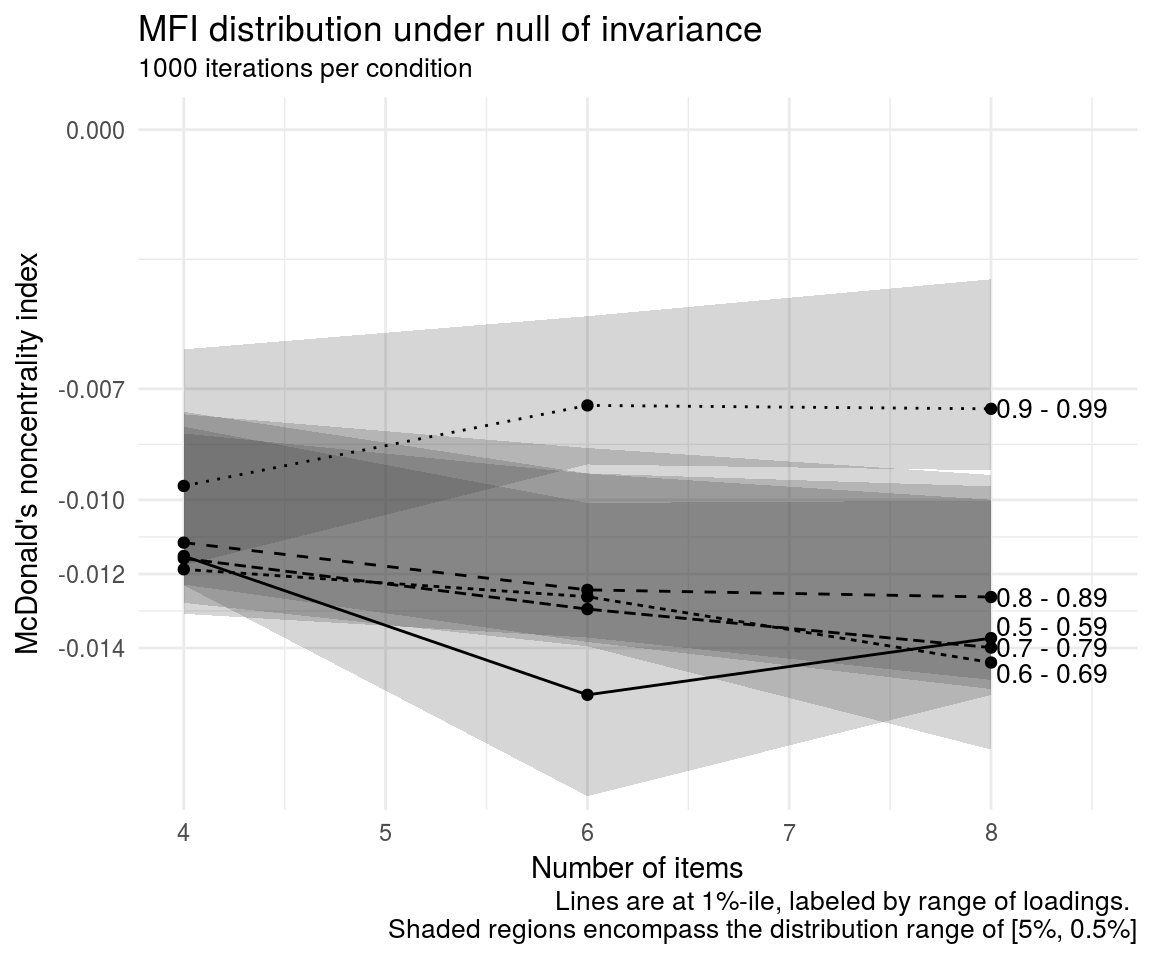
Values in the region above the shaded regions would lead us to conclude that measurement is invariant across group. Values below the shaded regions would lead us to reject the hypothesis of invariance.
Result tables
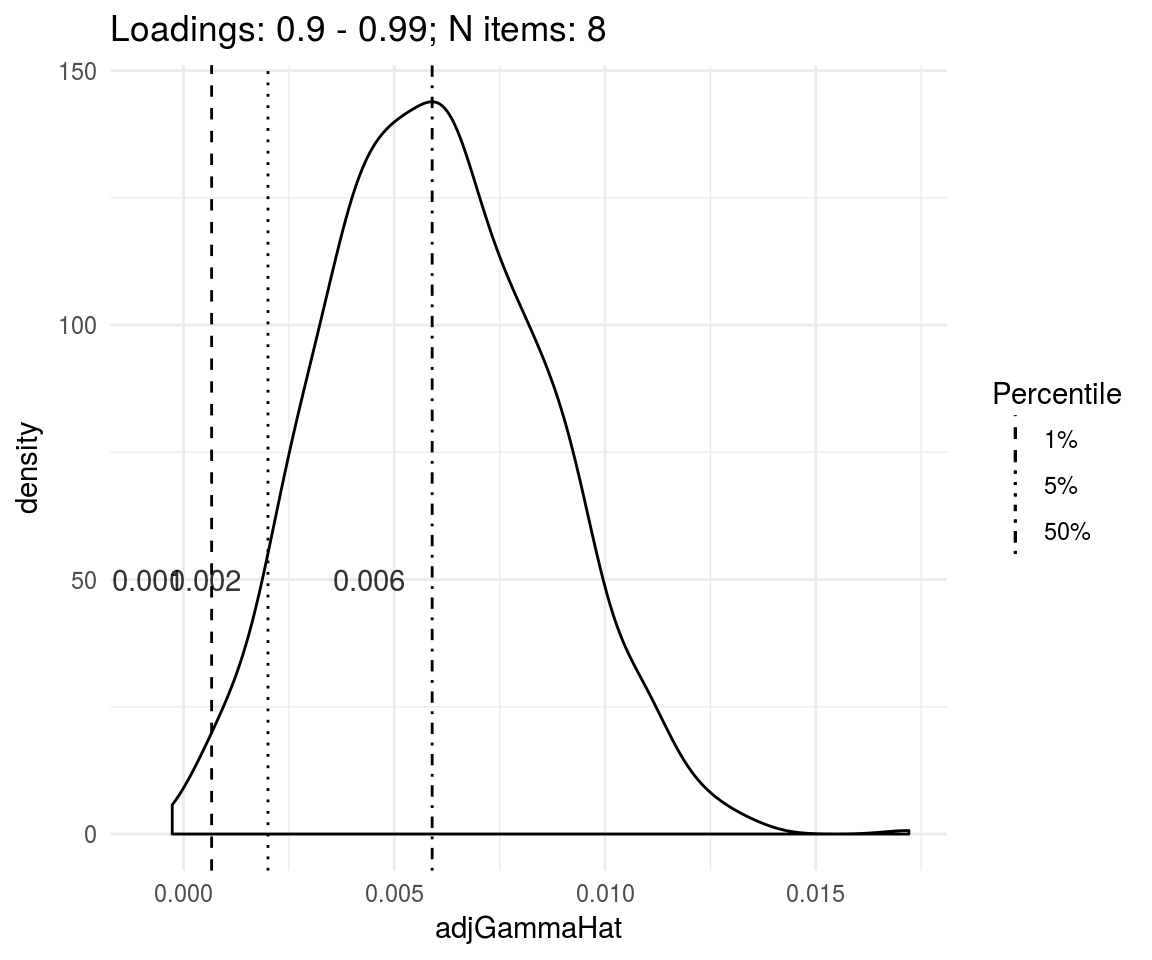
Quantiles over all iterations
| 0.0625% |
-0.0187088 |
-0.0128725 |
-0.0095414 |
-0.0045248 |
-0.0039535 |
| 0.5% |
-0.0140695 |
-0.0078816 |
-0.0074351 |
-0.0030029 |
-0.0028649 |
| 1% |
-0.0123715 |
-0.0064092 |
-0.0068067 |
-0.0025647 |
-0.0024016 |
| 5% |
-0.0083957 |
-0.0028587 |
-0.0041499 |
-0.0016768 |
-0.0013096 |
| 50% |
-0.0002159 |
-0.0000004 |
-0.0007547 |
-0.0000474 |
0.0008409 |
| 95% |
0.0069054 |
0.0023816 |
0.0017029 |
0.0012669 |
0.0112976 |
| 99% |
0.0097943 |
0.0047145 |
0.0047419 |
0.0017640 |
0.0252159 |
Loadings: 0.5 - 0.59; N items: 4
| 1% |
-0.0115 |
-0.0127 |
-0.0081 |
-0.0029 |
-0.0034 |
| 5% |
-0.0080 |
-0.0079 |
-0.0045 |
-0.0020 |
-0.0023 |
| 50% |
0.0000 |
0.0000 |
0.0000 |
0.0000 |
0.0002 |
| 95% |
0.0061 |
0.0064 |
0.0044 |
0.0015 |
0.0022 |
| 99% |
0.0081 |
0.0090 |
0.0085 |
0.0020 |
0.0029 |
Loadings: 0.6 - 0.69; N items: 4
| 1% |
-0.0119 |
-0.0076 |
-0.0083 |
-0.0030 |
-0.0033 |
| 5% |
-0.0082 |
-0.0048 |
-0.0047 |
-0.0021 |
-0.0022 |
| 50% |
-0.0002 |
0.0000 |
-0.0002 |
-0.0001 |
0.0003 |
| 95% |
0.0060 |
0.0034 |
0.0042 |
0.0015 |
0.0023 |
| 99% |
0.0079 |
0.0049 |
0.0093 |
0.0020 |
0.0029 |
Loadings: 0.7 - 0.79; N items: 4
| 1% |
-0.0116 |
-0.0039 |
-0.0074 |
-0.0029 |
-0.0028 |
| 5% |
-0.0076 |
-0.0026 |
-0.0042 |
-0.0019 |
-0.0020 |
| 50% |
0.0001 |
0.0000 |
-0.0007 |
0.0000 |
0.0006 |
| 95% |
0.0063 |
0.0022 |
0.0035 |
0.0016 |
0.0027 |
| 99% |
0.0079 |
0.0028 |
0.0083 |
0.0020 |
0.0037 |
Loadings: 0.8 - 0.89; N items: 4
| 1% |
-0.0112 |
-0.0023 |
-0.0048 |
-0.0028 |
-0.0025 |
| 5% |
-0.0077 |
-0.0015 |
-0.0033 |
-0.0020 |
-0.0013 |
| 50% |
-0.0002 |
0.0000 |
-0.0014 |
0.0000 |
0.0015 |
| 95% |
0.0054 |
0.0011 |
0.0017 |
0.0014 |
0.0042 |
| 99% |
0.0072 |
0.0014 |
0.0049 |
0.0019 |
0.0051 |
Loadings: 0.9 - 0.99; N items: 4
| 1% |
-0.0096 |
-0.0020 |
-0.0079 |
-0.0038 |
-0.0014 |
| 5% |
-0.0059 |
-0.0011 |
-0.0072 |
-0.0022 |
0.0010 |
| 50% |
-0.0007 |
-0.0001 |
-0.0042 |
-0.0003 |
0.0124 |
| 95% |
0.0035 |
0.0005 |
-0.0009 |
0.0011 |
0.0308 |
| 99% |
0.0055 |
0.0008 |
0.0013 |
0.0017 |
0.0341 |
Loadings: 0.5 - 0.59; N items: 6
| 1% |
-0.0153 |
-0.0089 |
-0.0044 |
-0.0026 |
-0.0027 |
| 5% |
-0.0101 |
-0.0057 |
-0.0026 |
-0.0017 |
-0.0016 |
| 50% |
0.0001 |
0.0000 |
-0.0002 |
0.0000 |
0.0003 |
| 95% |
0.0072 |
0.0042 |
0.0025 |
0.0012 |
0.0017 |
| 99% |
0.0096 |
0.0057 |
0.0052 |
0.0016 |
0.0023 |
Loadings: 0.6 - 0.69; N items: 6
| 1% |
-0.0126 |
-0.0042 |
-0.0048 |
-0.0022 |
-0.0022 |
| 5% |
-0.0093 |
-0.0030 |
-0.0028 |
-0.0016 |
-0.0015 |
| 50% |
0.0000 |
0.0000 |
-0.0003 |
0.0000 |
0.0003 |
| 95% |
0.0082 |
0.0026 |
0.0024 |
0.0014 |
0.0019 |
| 99% |
0.0106 |
0.0035 |
0.0046 |
0.0018 |
0.0024 |
Loadings: 0.7 - 0.79; N items: 6
| 1% |
-0.0129 |
-0.0024 |
-0.0032 |
-0.0022 |
-0.0019 |
| 5% |
-0.0093 |
-0.0017 |
-0.0023 |
-0.0016 |
-0.0013 |
| 50% |
0.0003 |
0.0000 |
-0.0005 |
0.0000 |
0.0005 |
| 95% |
0.0077 |
0.0015 |
0.0018 |
0.0013 |
0.0020 |
| 99% |
0.0101 |
0.0019 |
0.0035 |
0.0017 |
0.0024 |
Loadings: 0.8 - 0.89; N items: 6
| 1% |
-0.0124 |
-0.0015 |
-0.0025 |
-0.0022 |
-0.0017 |
| 5% |
-0.0086 |
-0.0010 |
-0.0019 |
-0.0016 |
-0.0008 |
| 50% |
-0.0001 |
0.0000 |
-0.0007 |
0.0000 |
0.0010 |
| 95% |
0.0072 |
0.0008 |
0.0007 |
0.0013 |
0.0026 |
| 99% |
0.0095 |
0.0011 |
0.0017 |
0.0017 |
0.0033 |
Loadings: 0.9 - 0.99; N items: 6
| 1% |
-0.0074 |
-0.0011 |
-0.0035 |
-0.0024 |
0.0003 |
| 5% |
-0.0050 |
-0.0007 |
-0.0030 |
-0.0015 |
0.0019 |
| 50% |
-0.0005 |
-0.0001 |
-0.0021 |
-0.0002 |
0.0071 |
| 95% |
0.0037 |
0.0004 |
-0.0008 |
0.0010 |
0.0140 |
| 99% |
0.0064 |
0.0006 |
-0.0002 |
0.0014 |
0.0166 |
Loadings: 0.5 - 0.59; N items: 8
| 1% |
-0.0137 |
-0.0055 |
-0.0028 |
-0.0018 |
-0.0017 |
| 5% |
-0.0100 |
-0.0039 |
-0.0017 |
-0.0013 |
-0.0011 |
| 50% |
0.0000 |
0.0000 |
-0.0003 |
0.0000 |
0.0003 |
| 95% |
0.0085 |
0.0031 |
0.0012 |
0.0011 |
0.0015 |
| 99% |
0.0122 |
0.0046 |
0.0020 |
0.0015 |
0.0019 |
Loadings: 0.6 - 0.69; N items: 8
| 1% |
-0.0144 |
-0.0032 |
-0.0027 |
-0.0019 |
-0.0017 |
| 5% |
-0.0100 |
-0.0021 |
-0.0016 |
-0.0013 |
-0.0011 |
| 50% |
0.0000 |
0.0000 |
-0.0003 |
0.0000 |
0.0004 |
| 95% |
0.0088 |
0.0019 |
0.0011 |
0.0012 |
0.0016 |
| 99% |
0.0115 |
0.0026 |
0.0018 |
0.0015 |
0.0021 |
Loadings: 0.7 - 0.79; N items: 8
| 1% |
-0.0140 |
-0.0017 |
-0.0020 |
-0.0019 |
-0.0016 |
| 5% |
-0.0096 |
-0.0013 |
-0.0015 |
-0.0013 |
-0.0010 |
| 50% |
-0.0001 |
0.0000 |
-0.0004 |
0.0000 |
0.0005 |
| 95% |
0.0089 |
0.0012 |
0.0009 |
0.0012 |
0.0018 |
| 99% |
0.0118 |
0.0016 |
0.0015 |
0.0016 |
0.0023 |
Loadings: 0.8 - 0.89; N items: 8
| 1% |
-0.0126 |
-0.0011 |
-0.0014 |
-0.0018 |
-0.0012 |
| 5% |
-0.0093 |
-0.0008 |
-0.0012 |
-0.0013 |
-0.0006 |
| 50% |
-0.0003 |
0.0000 |
-0.0005 |
0.0000 |
0.0008 |
| 95% |
0.0070 |
0.0006 |
0.0004 |
0.0010 |
0.0021 |
| 99% |
0.0098 |
0.0008 |
0.0009 |
0.0014 |
0.0025 |
Loadings: 0.9 - 0.99; N items: 8
| 1% |
-0.0075 |
-0.0012 |
-0.0022 |
-0.0025 |
0.0007 |
| 5% |
-0.0040 |
-0.0006 |
-0.0019 |
-0.0016 |
0.0020 |
| 50% |
-0.0004 |
-0.0001 |
-0.0014 |
-0.0002 |
0.0059 |
| 95% |
0.0031 |
0.0003 |
-0.0007 |
0.0008 |
0.0105 |
| 99% |
0.0049 |
0.0004 |
-0.0002 |
0.0012 |
0.0120 |
Result plots
References
Kang, Y., McNeish, D. M., & Hancock, G. R. (2016). The Role of Measurement Quality on Practical Guidelines for Assessing Measurement and Structural Invariance. Educational and Psychological Measurement, 76(4), 533–561. https://doi.org/10.1177/0013164415603764
McNeish, D., An, J., & Hancock, G. R. (2018). The Thorny Relation Between Measurement Quality and Fit Index Cutoffs in Latent Variable Models. Journal of Personality Assessment, 100(1), 43–52. https://doi.org/10.1080/00223891.2017.1281286